Project Overview
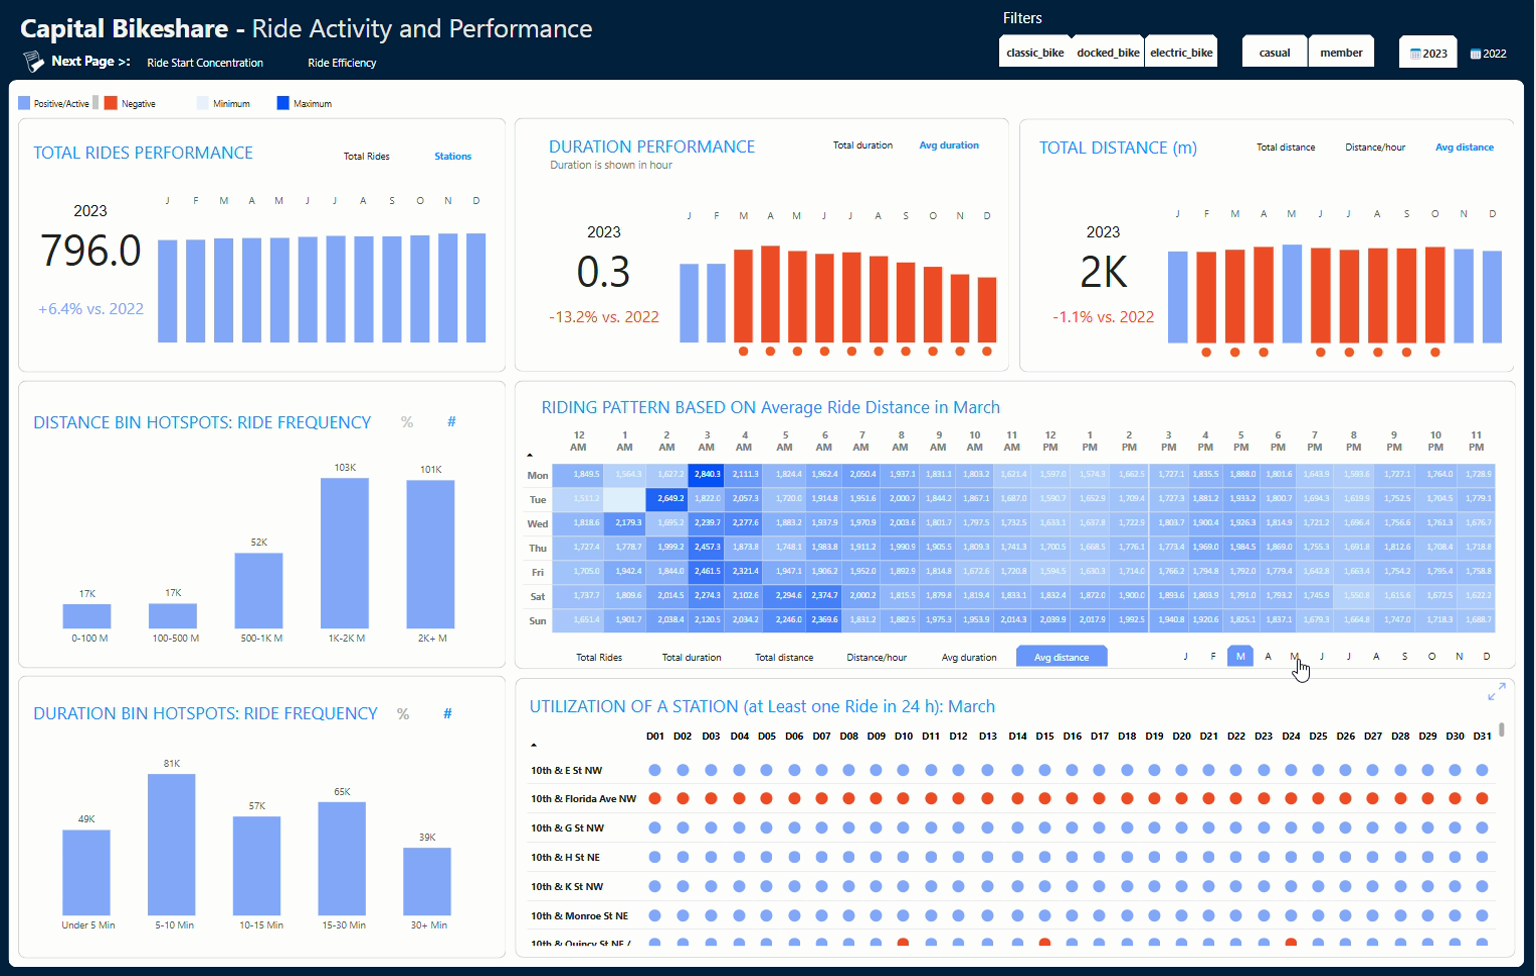
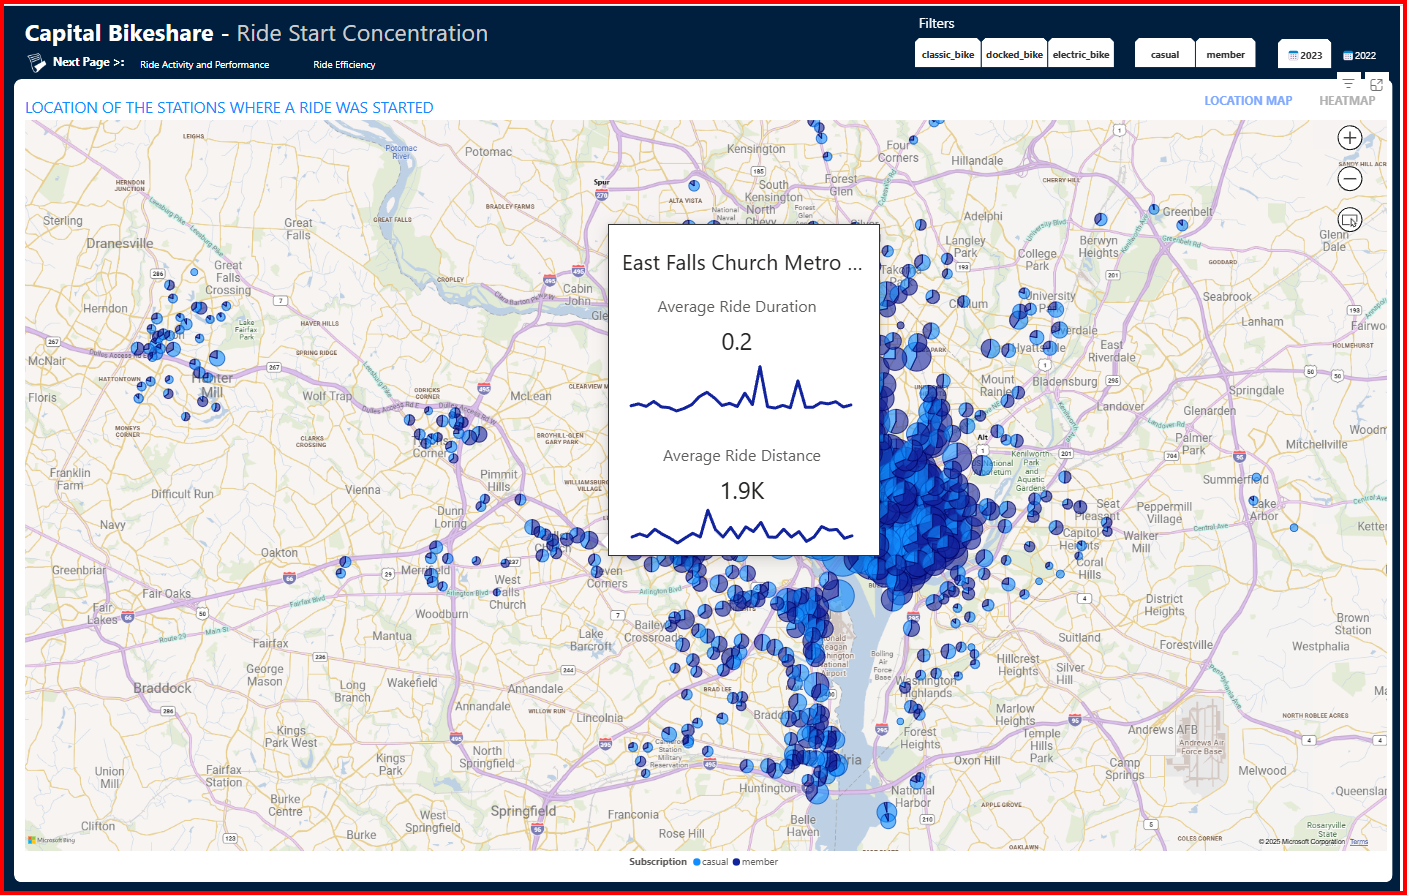
This project involved designing and developing a Power BI dashboard to analyze bikeshare trends using data from Capital Bikeshare. The dashboard provides insights into ridership patterns, trip durations, distances traveled, and bike type preferences for 2022 and 2023. The goal was to uncover trends that could help optimize bike availability, improve user experience, and support infrastructure planning.
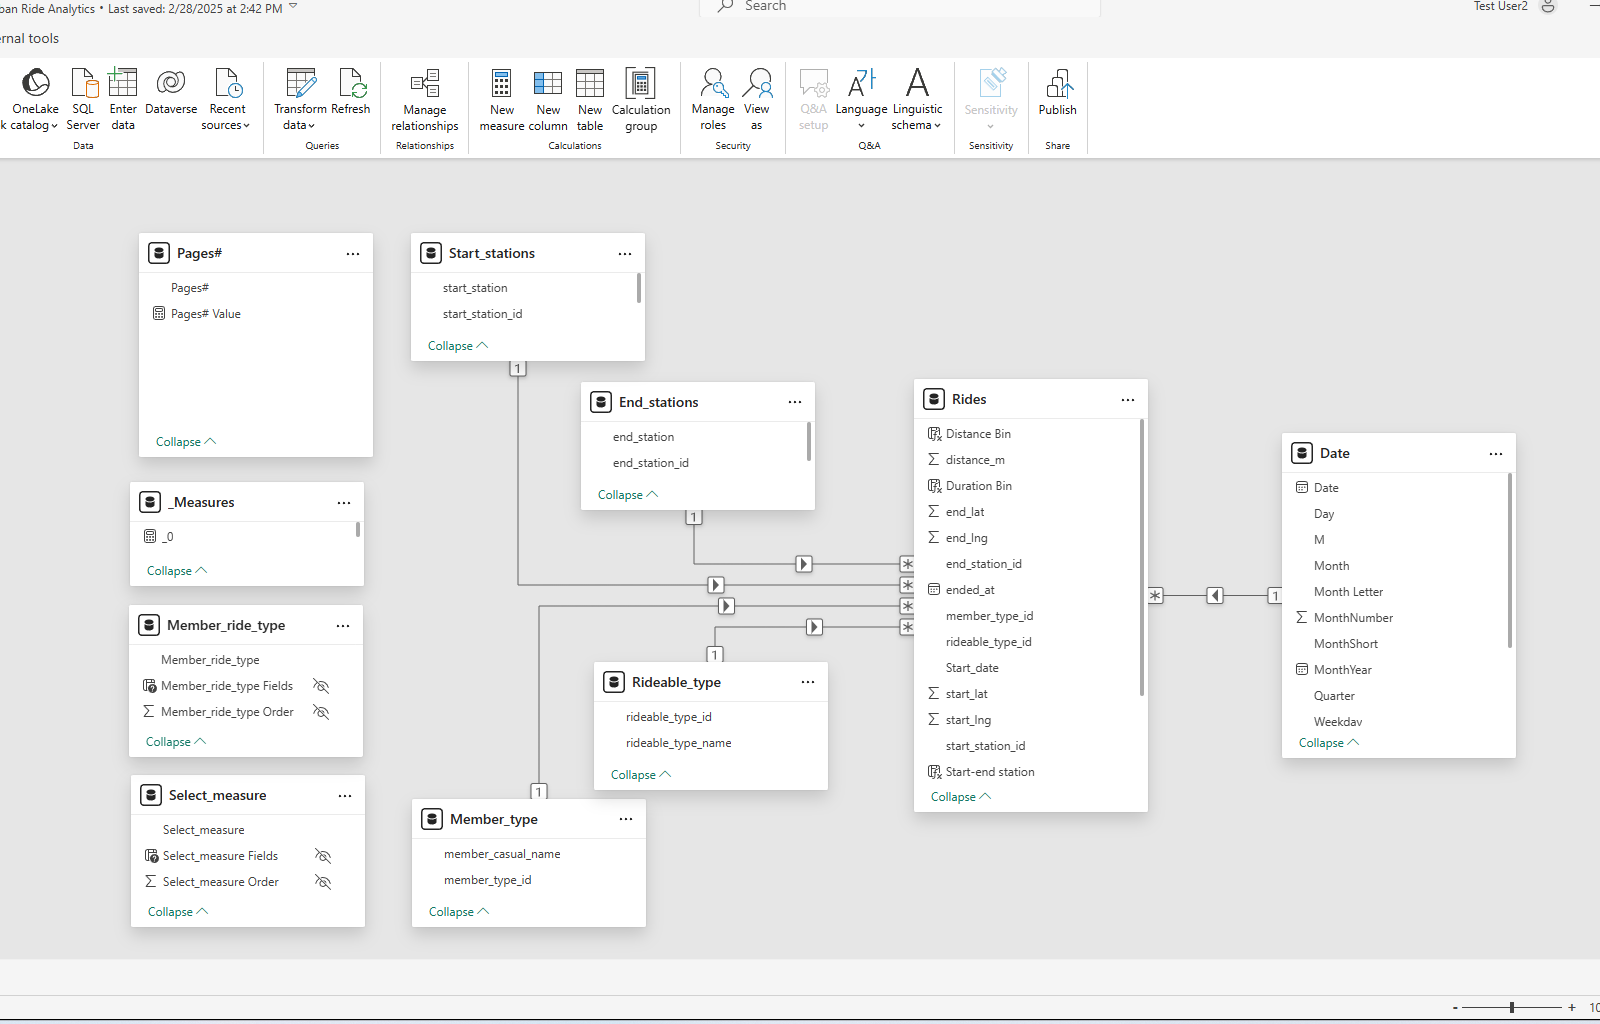
By extracting, transforming, and modeling over 8 million ride records from CSV files stored in Amazon S3, I created an interactive and visually appealing dashboard that allows stakeholders to explore bikeshare adoption trends, peak usage times, and station utilization patterns.
Recommendations
✔ Expand bike availability during peak commuting hours – Ensuring more bikes at key stations will enhance accessibility.
✔ Optimize pricing structures – Encouraging mid-range trips can increase engagement without over-penalizing long rides.
✔ Redistribute bikes based on usage patterns – Relocate underused docked bikes to high-traffic areas.
✔ Promote electric bike adoption – Offering incentives for e-bike memberships could increase longer ride frequencies.
✔ Enhance station placement strategies – Prioritize 1-2 km station spacing to match majority ride patterns.
Final Thoughts
This Capital Bikeshare Power BI dashboard provided data-driven insights into user behavior, seasonal trends, and bike utilization patterns. The findings support infrastructure planning, fleet optimization, and pricing strategy improvements to enhance the overall bikeshare experience.
Project Link
Fabric Community-PowerBI Viz Championship Gallery
                    import requests
import zipfile
import io
import pandas as pd

source_df=[
 'https://s3.amazonaws.com/capitalbikeshare-data/202201-capitalbikeshare-tripdata.zip',
 'https://s3.amazonaws.com/capitalbikeshare-data/202202-capitalbikeshare-tripdata.zip',
 'https://s3.amazonaws.com/capitalbikeshare-data/202203-capitalbikeshare-tripdata.zip',
 'https://s3.amazonaws.com/capitalbikeshare-data/202204-capitalbikeshare-tripdata.zip',
 'https://s3.amazonaws.com/capitalbikeshare-data/202205-capitalbikeshare-tripdata.zip',
 'https://s3.amazonaws.com/capitalbikeshare-data/202206-capitalbikeshare-tripdata.zip',
 'https://s3.amazonaws.com/capitalbikeshare-data/202207-capitalbikeshare-tripdata.zip',
 'https://s3.amazonaws.com/capitalbikeshare-data/202208-capitalbikeshare-tripdata.zip',
 'https://s3.amazonaws.com/capitalbikeshare-data/202209-capitalbikeshare-tripdata.zip',
 'https://s3.amazonaws.com/capitalbikeshare-data/202210-capitalbikeshare-tripdata.zip',
 'https://s3.amazonaws.com/capitalbikeshare-data/202211-capitalbikeshare-tripdata.zip',
 'https://s3.amazonaws.com/capitalbikeshare-data/202212-capitalbikeshare-tripdata.zip',
 'https://s3.amazonaws.com/capitalbikeshare-data/202301-capitalbikeshare-tripdata.zip',
 'https://s3.amazonaws.com/capitalbikeshare-data/202302-capitalbikeshare-tripdata.zip',
 'https://s3.amazonaws.com/capitalbikeshare-data/202303-capitalbikeshare-tripdata.zip',
 'https://s3.amazonaws.com/capitalbikeshare-data/202304-capitalbikeshare-tripdata.zip',
 'https://s3.amazonaws.com/capitalbikeshare-data/202305-capitalbikeshare-tripdata.zip',
 'https://s3.amazonaws.com/capitalbikeshare-data/202306-capitalbikeshare-tripdata.zip',
 'https://s3.amazonaws.com/capitalbikeshare-data/202307-capitalbikeshare-tripdata.zip',
 'https://s3.amazonaws.com/capitalbikeshare-data/202308-capitalbikeshare-tripdata.zip',
 'https://s3.amazonaws.com/capitalbikeshare-data/202309-capitalbikeshare-tripdata.zip',
 'https://s3.amazonaws.com/capitalbikeshare-data/202310-capitalbikeshare-tripdata.zip',
 'https://s3.amazonaws.com/capitalbikeshare-data/202311-capitalbikeshare-tripdata.zip',
 'https://s3.amazonaws.com/capitalbikeshare-data/202312-capitalbikeshare-tripdata.zip'
]

# Lists to hold data from each CSV extraction
rides_list = []
start_stations_list = []
end_stations_list = []

# Iterate through each ZIP URL in the source list
for zip_url in source_df:
    print(f"Processing: {zip_url}")
    try:
        response = requests.get(zip_url)
        response.raise_for_status()
        with zipfile.ZipFile(io.BytesIO(response.content)) as z:
            for file_name in z.namelist():
                # Skip system files
                if file_name.startswith("__MACOSX") or file_name.endswith(".DS_Store"):
                    continue
                if file_name.lower().endswith('.csv'):
                    with z.open(file_name) as f:
                        try:
                            # Read CSV file into a DataFrame
                            df = pd.read_csv(f, low_memory=False)
                            print(f"Loaded {file_name} with shape {df.shape}")

                            # Extract rides table
                            # Select the columns from the original DataFrame
                            rides = df[['rideable_type', 'started_at', 'ended_at',
                                        'start_station_id', 'start_station_name',
                                        'end_station_id', 'end_station_name',
                                        'member_casual', 'start_lat', 'start_lng', 'end_lat', 'end_lng']]

                            rides = rides.copy()

                            rides.loc[:, 'member_casual'] = rides['member_casual'].map({'casual': 2, 'member': 1})
                            rides.loc[:, 'rideable_type'] = rides['rideable_type'].map({'electric_bike': 3, 'docked_bike': 2, 'classic_bike': 1})
                            rides_list.append(rides)
                        except Exception as e:
                            print(f"Error reading {file_name} in {zip_url}: {e}")
    except Exception as e:
        print(f"Error processing {zip_url}: {e}")

# Combine extracted data from all files
if rides_list:
    rides_df = pd.concat(rides_list, ignore_index=True)

    rides_df['start_station'] = rides_df['start_station_id'].apply(lambda x: str(int(x)) if pd.notnull(x) else '') + '-' + rides_df['start_station_name']
    rides_df['end_station'] = rides_df['end_station_id'].apply(lambda x: str(int(x)) if pd.notnull(x) else '') + '-' + rides_df['end_station_name']

    # rides_df = rides_df[
    #     rides_df['start_station'].notna() & (rides_df['start_station'].astype(str).str.strip() != '') &
    #     rides_df['end_station'].notna()   & (rides_df['end_station'].astype(str).str.strip() != '')
    # ]

    rides_df['started_at'] = pd.to_datetime(rides_df['started_at'], errors='coerce')
    rides_df['ended_at'] = pd.to_datetime(rides_df['ended_at'], errors='coerce')

    # Filter rows where the difference in seconds is less than 30 seconds
    # rides_df = rides_df[(rides_df['ended_at'] - rides_df['started_at']).dt.total_seconds() > 0]

    rides_df=rides_df.drop(columns=['start_station_id', 'start_station_name','end_station_id','end_station_name'])


    unique_start_stations = rides_df['start_station'].drop_duplicates().reset_index(drop=True)
    unique_start_stations_df = pd.DataFrame({'start_station': unique_start_stations})
    unique_start_stations_df['start_station_id'] = unique_start_stations_df.index + 100  # IDs starting at 100
    unique_start_stations_df.to_csv('start_stations2.csv',index=False)

    unique_end_stations = rides_df['end_station'].drop_duplicates().reset_index(drop=True)
    unique_end_stations_df = pd.DataFrame({'end_station': unique_end_stations})
    unique_end_stations_df['end_station_id'] = unique_end_stations_df.index + 10  # IDs starting at 10
    unique_end_stations_df.to_csv('end_stations2.csv',index=False)

    rides_final_df_1 = pd.merge(rides_df, unique_start_stations_df, on='start_station', how='inner')
    rides_final_df_2 = pd.merge(rides_final_df_1, unique_end_stations_df, on='end_station', how='inner')
    rides_final_df_2=rides_final_df_2.drop(columns=['start_station','end_station'])

    rides_final_df_2.to_csv("Rides2.csv", index=False)
    print("Combined Rides DataFrame shape:", rides_df.shape)
else:
    rides_df = pd.DataFrame()
    print("No Rides data found.")

# CREATE MEMBER TABLE
member_data = {
    'member_casual': [1, 2],
    'member_casual_name': ['member', 'casual']
}

Members = pd.DataFrame(member_data)

Members.to_csv('member_type.csv',index=False)

# CREATE RIDE TYPES TABLE
type_data = {
    'rideable_type': [1, 2,3],
    'rideable_type_name': ['classic_bike', 'docked_bike','electric_bike']
}

Rideable_type = pd.DataFrame(type_data)
Rideable_type.to_csv('Rideable_type.csv',index=False)
print("Data proccess completed")