Data Integration & BI Developer
Star-schema warehouses, ETL/SSIS pipelines, and governed Power BI and Fabric models that scale.
Data Integration & BI Specialist · ASP.NET Core & SQL Developer
I design and build data platforms, business-intelligence solutions, and ASP.NET Core applications that turn complex healthcare and public-sector data into governed, decision-ready insight — with more than 15 years of hands-on delivery.

Hi, welcome to my portfolio website. I’m Hafizullah Mahmudi, a Business Intelligence, data, and software development professional with more than 15 years of experience designing data platforms, reporting systems, analytical solutions, and business applications.
My work focuses on transforming complex and disconnected data into reliable, governed, and actionable information. I have designed SQL reporting databases, star-schema data warehouses, ETL workflows, semantic models, Power BI dashboards, data-quality processes, and web-based information systems for healthcare, nonprofit, public-sector, private-sector, and operational environments.
My technical experience includes Power BI, DAX, Power Query, Microsoft Fabric, SQL Server, PostgreSQL, SSIS, ASP.NET Core MVC, C#, Entity Framework Core, Python, JavaScript, Microsoft Access, VBA, Azure fundamentals, Snowflake SQL, and GitHub. I also use AI-assisted analytics and agentic AI to improve data exploration, automate reporting workflows, generate insights, and make complex information easier for users to access.
One of my recent projects involved developing an agentic AI assistant that translates natural-language questions into safe, parameterized data queries and presents the results through tables, charts, KPI cards, crosstabs, maps, and analytical summaries. I am especially interested in combining business intelligence, data engineering, software development, and AI to create practical solutions that improve decision-making and user productivity.
Explore my portfolio to see examples of my dashboards, databases, data platforms, reporting solutions, and software projects. You can also connect with me through LinkedIn or GitHub to discuss business intelligence, data engineering, software development, AI-enabled analytics, or potential collaboration opportunities.
A snapshot of how I contribute — see the Experience section below for the full career history.
Star-schema warehouses, ETL/SSIS pipelines, and governed Power BI and Fabric models that scale.
HMIS, DHIS2, and national health platforms with strong data-quality and reporting practices.
Multi-user applications with C#, Entity Framework Core, and SQL Server backing real operations.
Fabric Analytics Engineer and Power BI Data Analyst Associate, plus BI and data-warehouse certifications.
The platforms and languages I use day-to-day to deliver reliable data and software solutions.
 Power BI Power BI |
 PostgreSQL PostgreSQL |
 Microsoft Fabric Microsoft Fabric |
 Python Python |
 Tableau Tableau |
 SQL Server SQL Server |
 |
 C# C# |
 |
 Microsoft Access Microsoft Access |
 |
 |
 Microsoft Excel Microsoft Excel |
 API Development API Development |
 Agentic AI Agentic AI |
GitHub |
Data Transformation: Cleaning, standardizing, validating, and transforming raw data into reliable datasets for reporting and analysis.
Data Integration & Mapping: Combining data from multiple systems and mapping source data elements to consistent reporting structures and target schemas.
SQL Analytics: Writing advanced SQL queries using joins, subqueries, common table expressions, window functions, aggregations, and performance-optimization techniques.
Power BI Dashboards: Designing professional, interactive dashboards, KPI scorecards, drill-through reports, maps, trend analyses, and executive reporting solutions.
DAX & Semantic Models: Developing reusable measures, calculated tables, time-intelligence calculations, relationships, hierarchies, and governed business metrics.
Power Query, Dataflows & Refresh: Building repeatable transformation processes, reusable dataflows, parameterized queries, and reliable refresh workflows.
Report Migration: Modernizing Excel, Access, Tableau-style, and legacy reports into governed Power BI dashboards and reusable reporting datasets.
AI-Assisted Data Analytics: Using AI to accelerate data exploration, SQL development, documentation, quality reviews, insight generation, and reporting workflows.
Agentic AI Solutions: Building AI assistants that translate natural-language questions into safe, parameterized data queries and return tables, charts, maps, KPI cards, and analytical summaries.
Data Visualization & Storytelling: Communicating trends, comparisons, risks, performance indicators, and actionable insights through clear visual narratives.
Advanced Excel Analysis: Using PivotTables, lookup functions, Power Query, formulas, charts, data validation, and VBA automation for business reporting.
Custom Visualizations: Creating specialized charts, SVG-based visuals, conditional formatting, infographics, embedded reports, and interactive analytical experiences.
Security & Governance: Implementing Row-Level Security, controlled access, reusable datasets, documentation, validation rules, and trusted reporting standards.
Relational Database Design: Designing scalable relational database schemas, relationships, constraints, and data structures for operational and reporting systems.
SQL Server & PostgreSQL: Developing optimized SQL queries, views, stored procedures, functions, and reporting databases.
Data Warehousing: Building staging layers, ETL/ELT pipelines, fact and dimension tables, data marts, and star-schema data warehouses.
Dimensional & Semantic Modeling: Designing reusable data models, relationships, measures, hierarchies, and trusted KPI layers for analytics.
Data Quality & Validation: Implementing validation rules, exception reports, plausibility checks, reconciliation processes, and quality-control workflows.
Documentation & Data Presentation: Creating data dictionaries, mapping documents, QA checklists, technical documentation, and clear presentations for business stakeholders.
C# & ASP.NET Core: Developing secure, maintainable web applications using ASP.NET Core MVC, Razor, Entity Framework Core, and modern .NET technologies.
Web & API Development: Building REST APIs, application services, data-entry workflows, validation processes, and system integrations.
Frontend Development: Creating responsive and user-friendly interfaces with JavaScript, HTML, CSS, Bootstrap, jQuery, and DataTables.
AI-Enabled Applications: Integrating agentic AI, natural-language querying, prompt management, and AI-assisted analytics into reporting and business applications.
Python & VBA Automation: Automating data preparation, reporting, validation, and repetitive business processes using Python, Excel VBA, and Access VBA.
Version Control: Using Git and GitHub for source-code management, collaboration, documentation, and controlled software delivery.
More than 15 years across data systems, business intelligence, and software development.
Liverpool John Moores University, United Kingdom
Kateb University, Afghanistan
Microsoft Azure Data, Tableau, SQL Server, Business Intelligence, Data Warehousing, Python, and Data Visualization
Case studies in data integration, business intelligence, and application development.
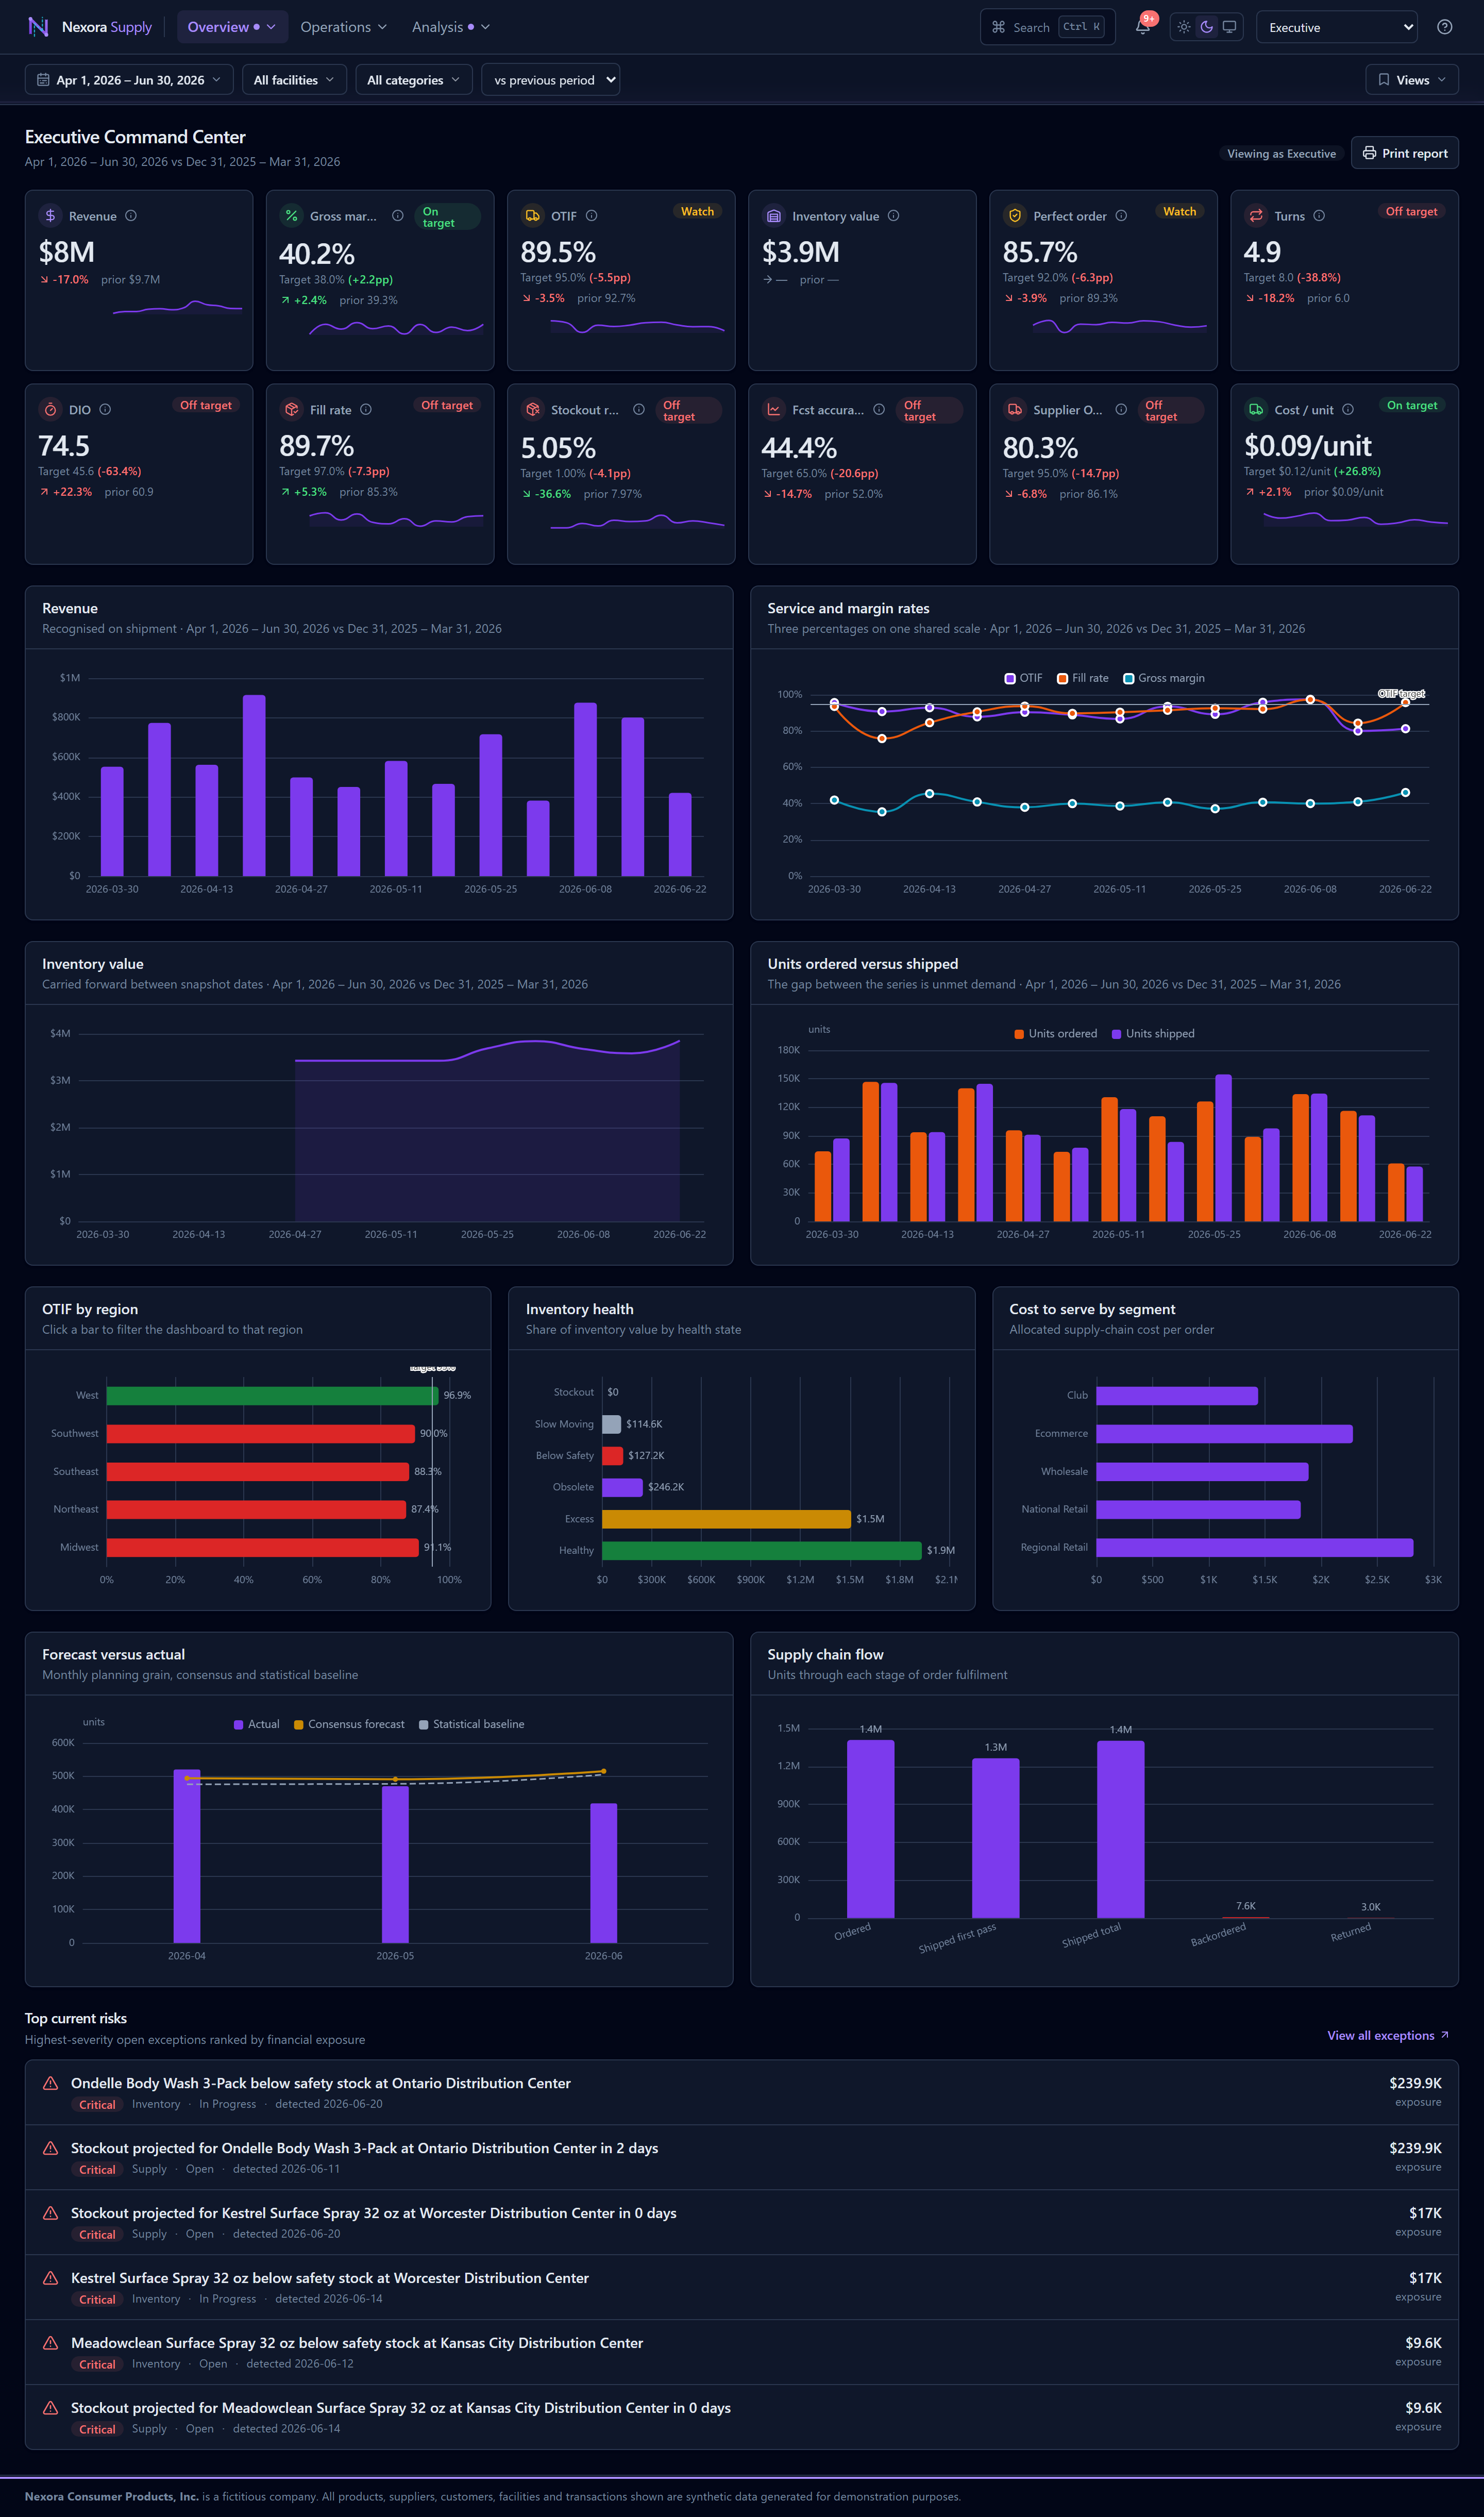
An AI-assisted supply-chain analytics platform — built on a reproducible 62,000-row simulation, a single semantic metric layer, and a decision-grade design system. Served by ASP.NET Core over PostgreSQL.
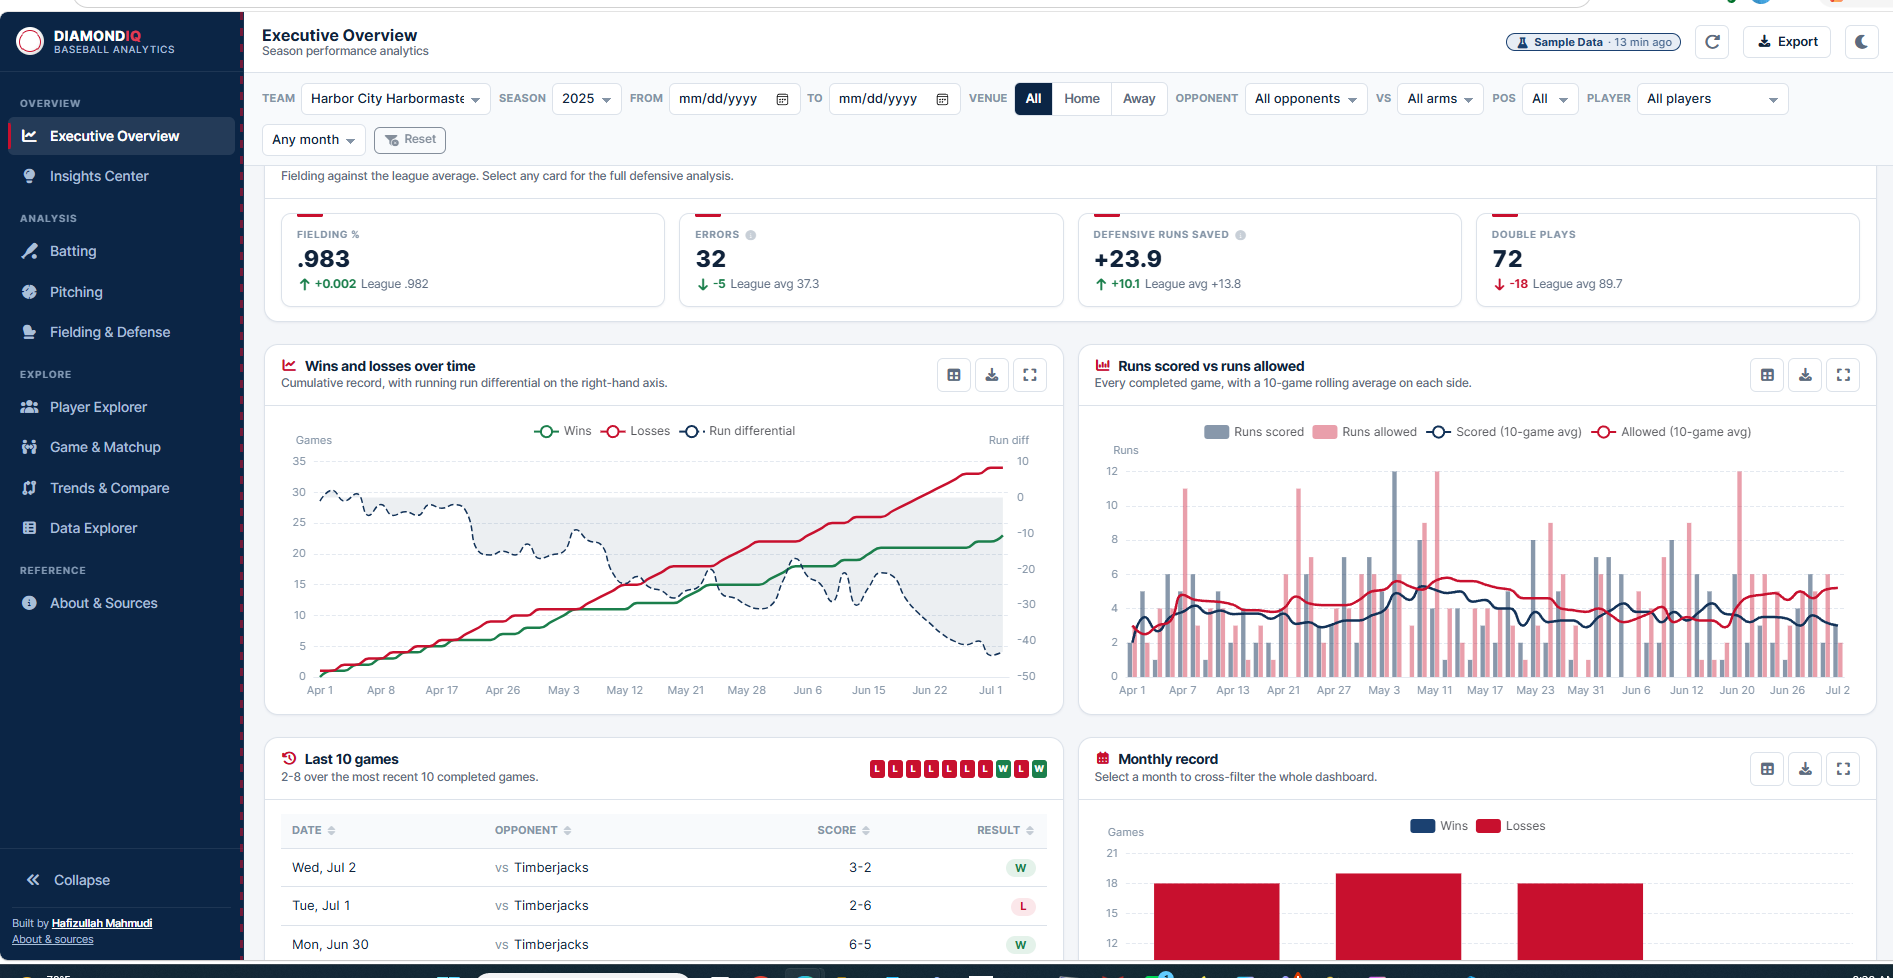
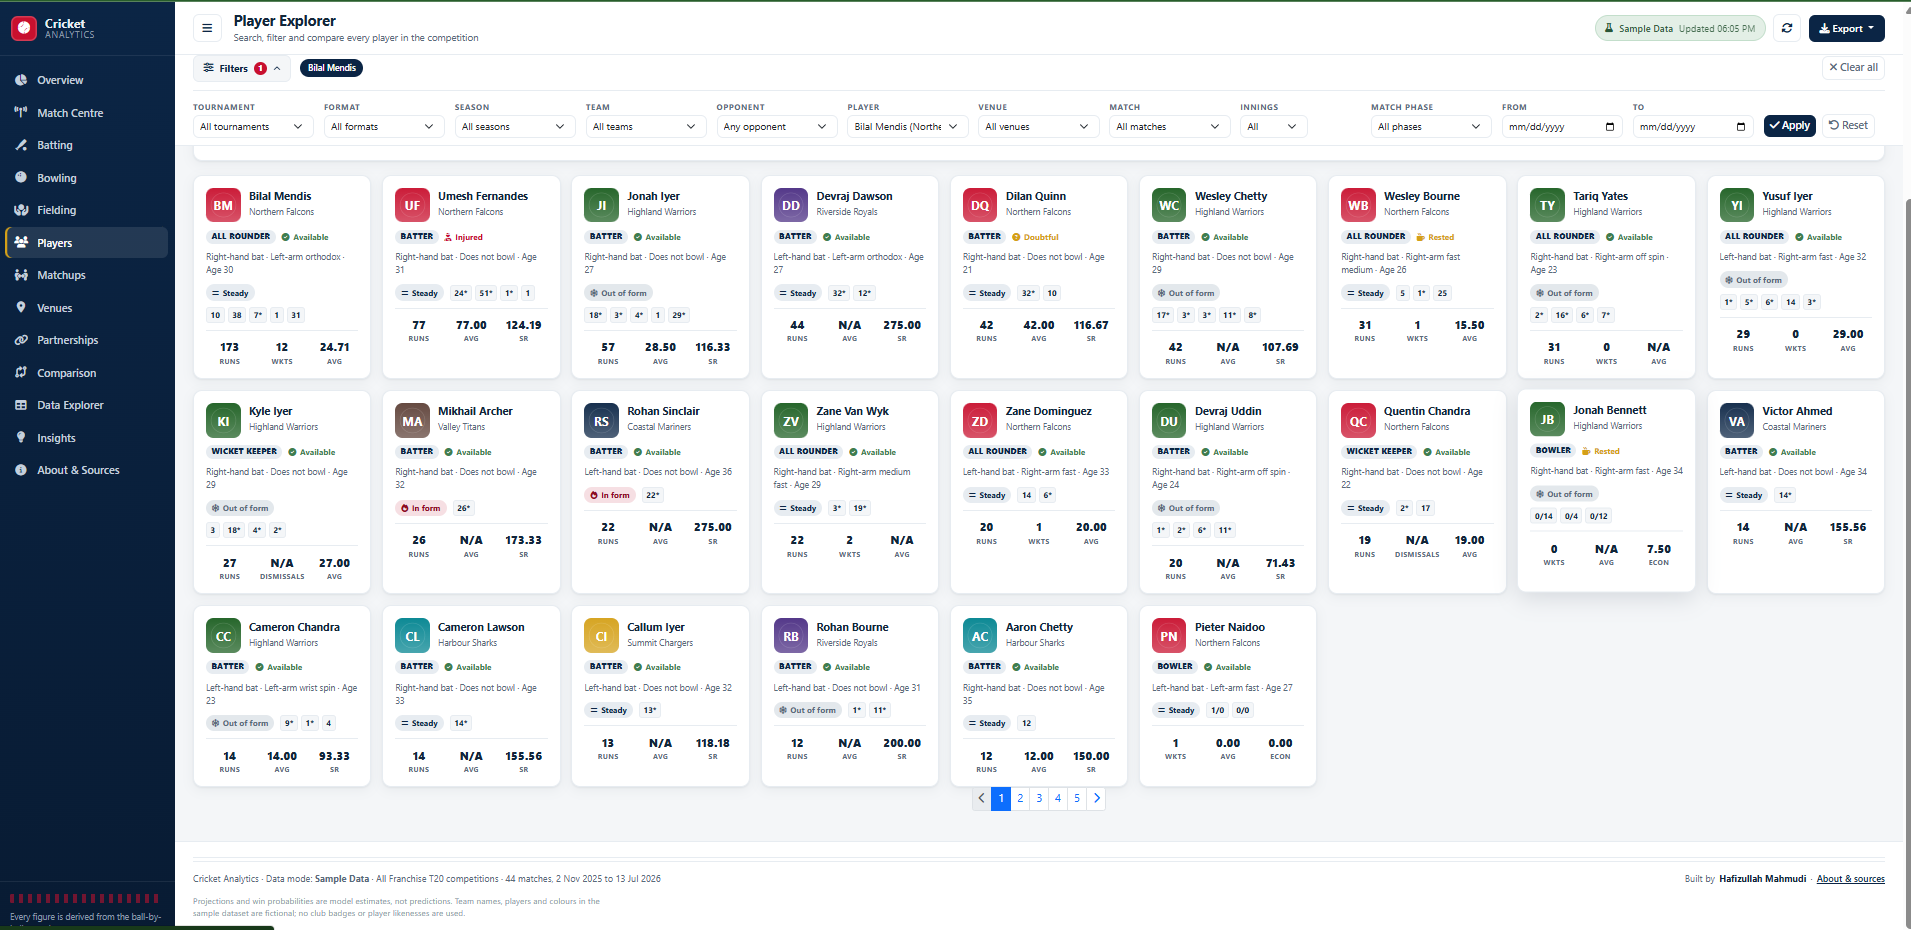
An end-to-end baseball analytics platform that turns raw game data into readable analysis. It covers team and player performance across batting, pitching and fielding, with matchup comparisons, trend analysis, a raw-data explorer, and an insight engine that converts statistics into plain-language findings. The application runs on either a live data provider or a fully simulated season, and it always tells the user which one it is showing. It was built around a single principle: never display a number the data does not support. Live demo: diamond-iq.pages.dev · Source: github.com/hafizmahmudi/diamond-iq
End-to-end data and software services — from raw source systems to governed dashboards and production applications.
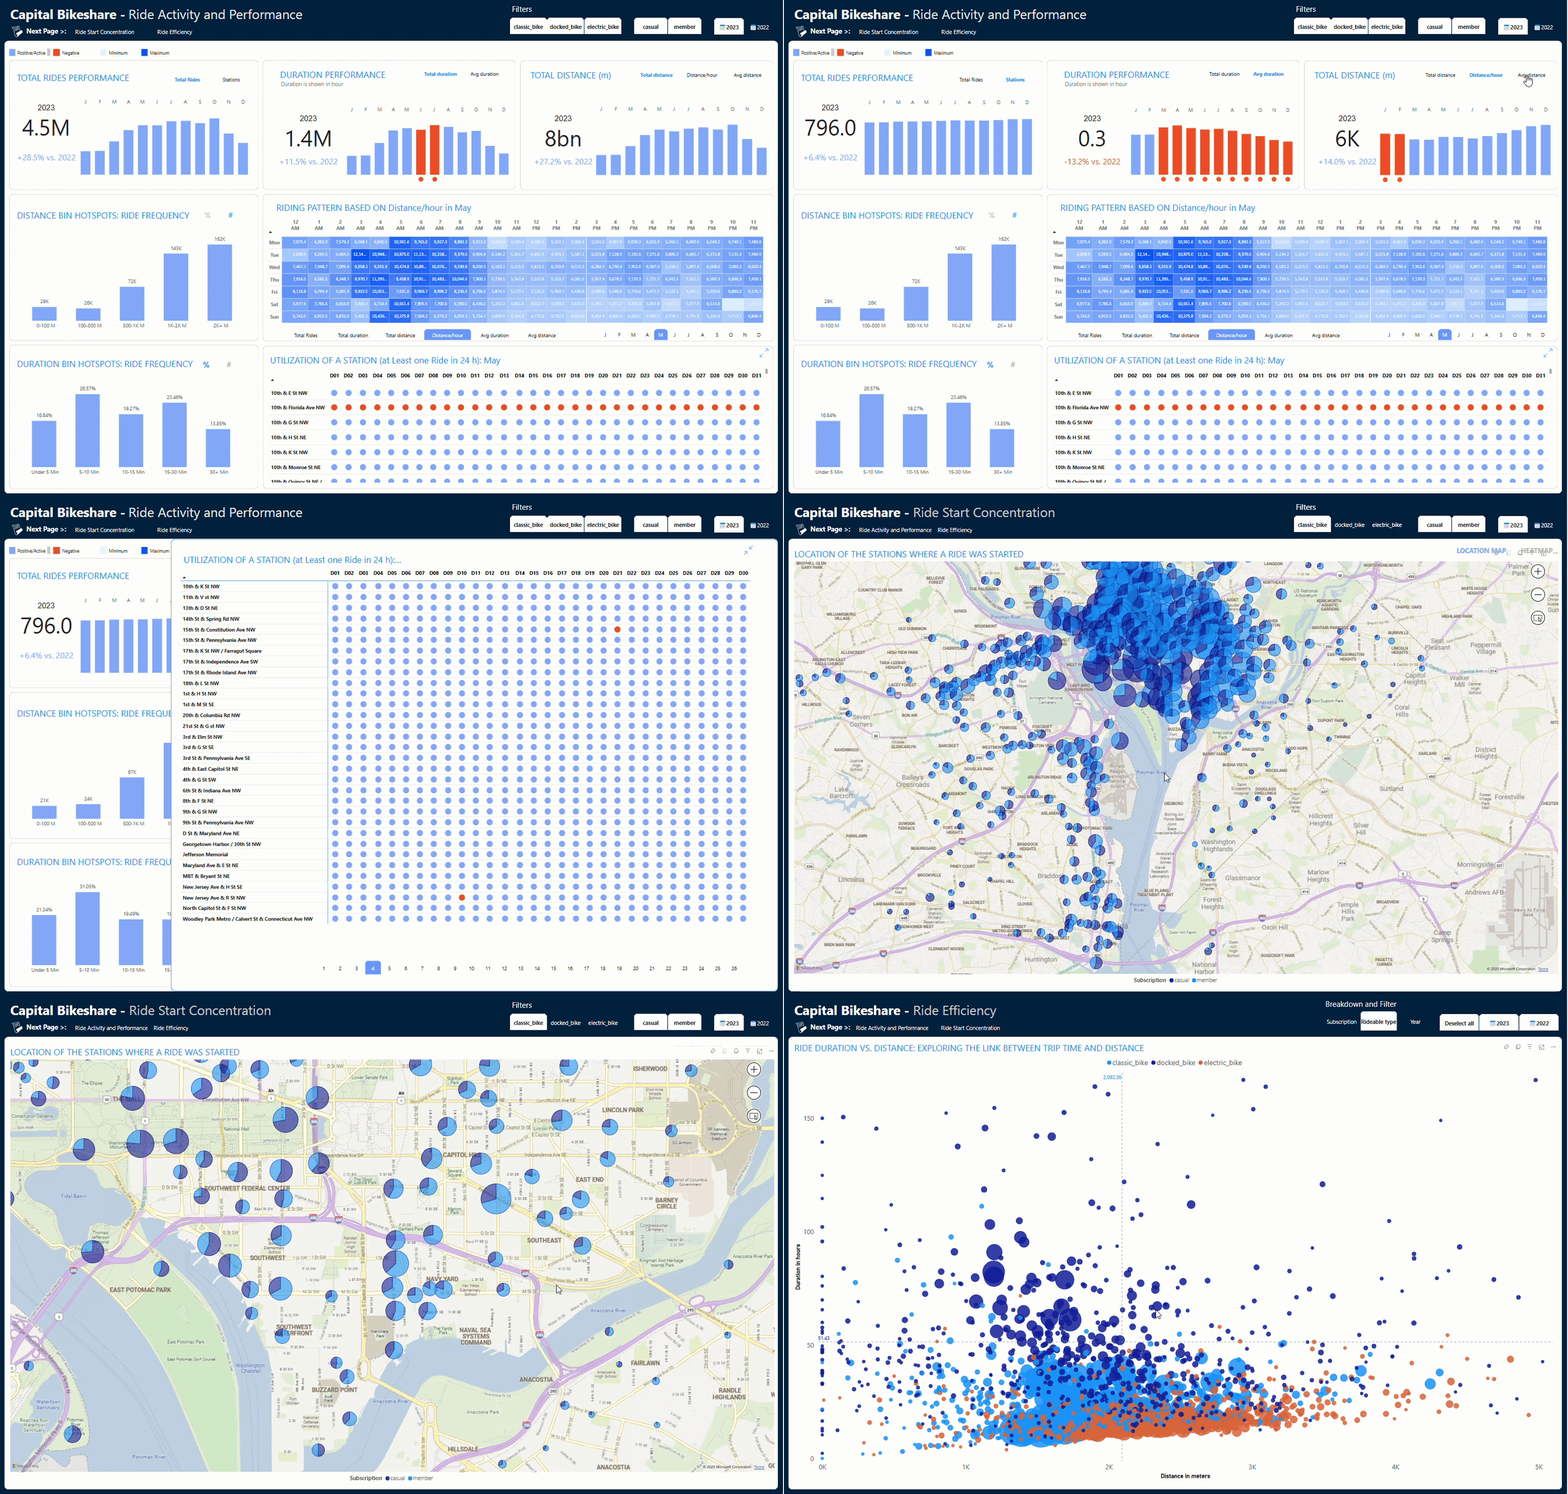
Power BI and Microsoft Fabric solutions — data models, DAX measures, and interactive dashboards that give teams trustworthy, self-service analytics.
Dimensional data warehouses on SQL Server and PostgreSQL, with robust SSIS and Power Query ETL pipelines that keep reporting fast and consistent.
Multi-user web applications built with ASP.NET Core MVC, C#, and Entity Framework Core — secure, maintainable, and integrated with your data platform.
HMIS, DHIS2, and nutrition information platforms — indicator design, data synchronization, and reporting tailored to public-health programs.
Migration of manual Excel, Access, and legacy reports into reusable SQL views, governed datasets, and modern Power BI dashboards with row-level security.
Validation rules, reconciliation, and reporting automation that reduce manual effort and raise confidence in every number you publish.
Notes and tutorials from my work in data, BI, and software engineering.
New articles are on the way — check back soon.
Whether you need a Power BI solution, a data warehouse, report modernization, or an ASP.NET Core application, I'd be glad to hear about your project and how I can help.