Utilized SQL for robust data manipulation, ensuring high-quality data for analysis.
Public Health Expenditure Overview Dashboard
About EMIS
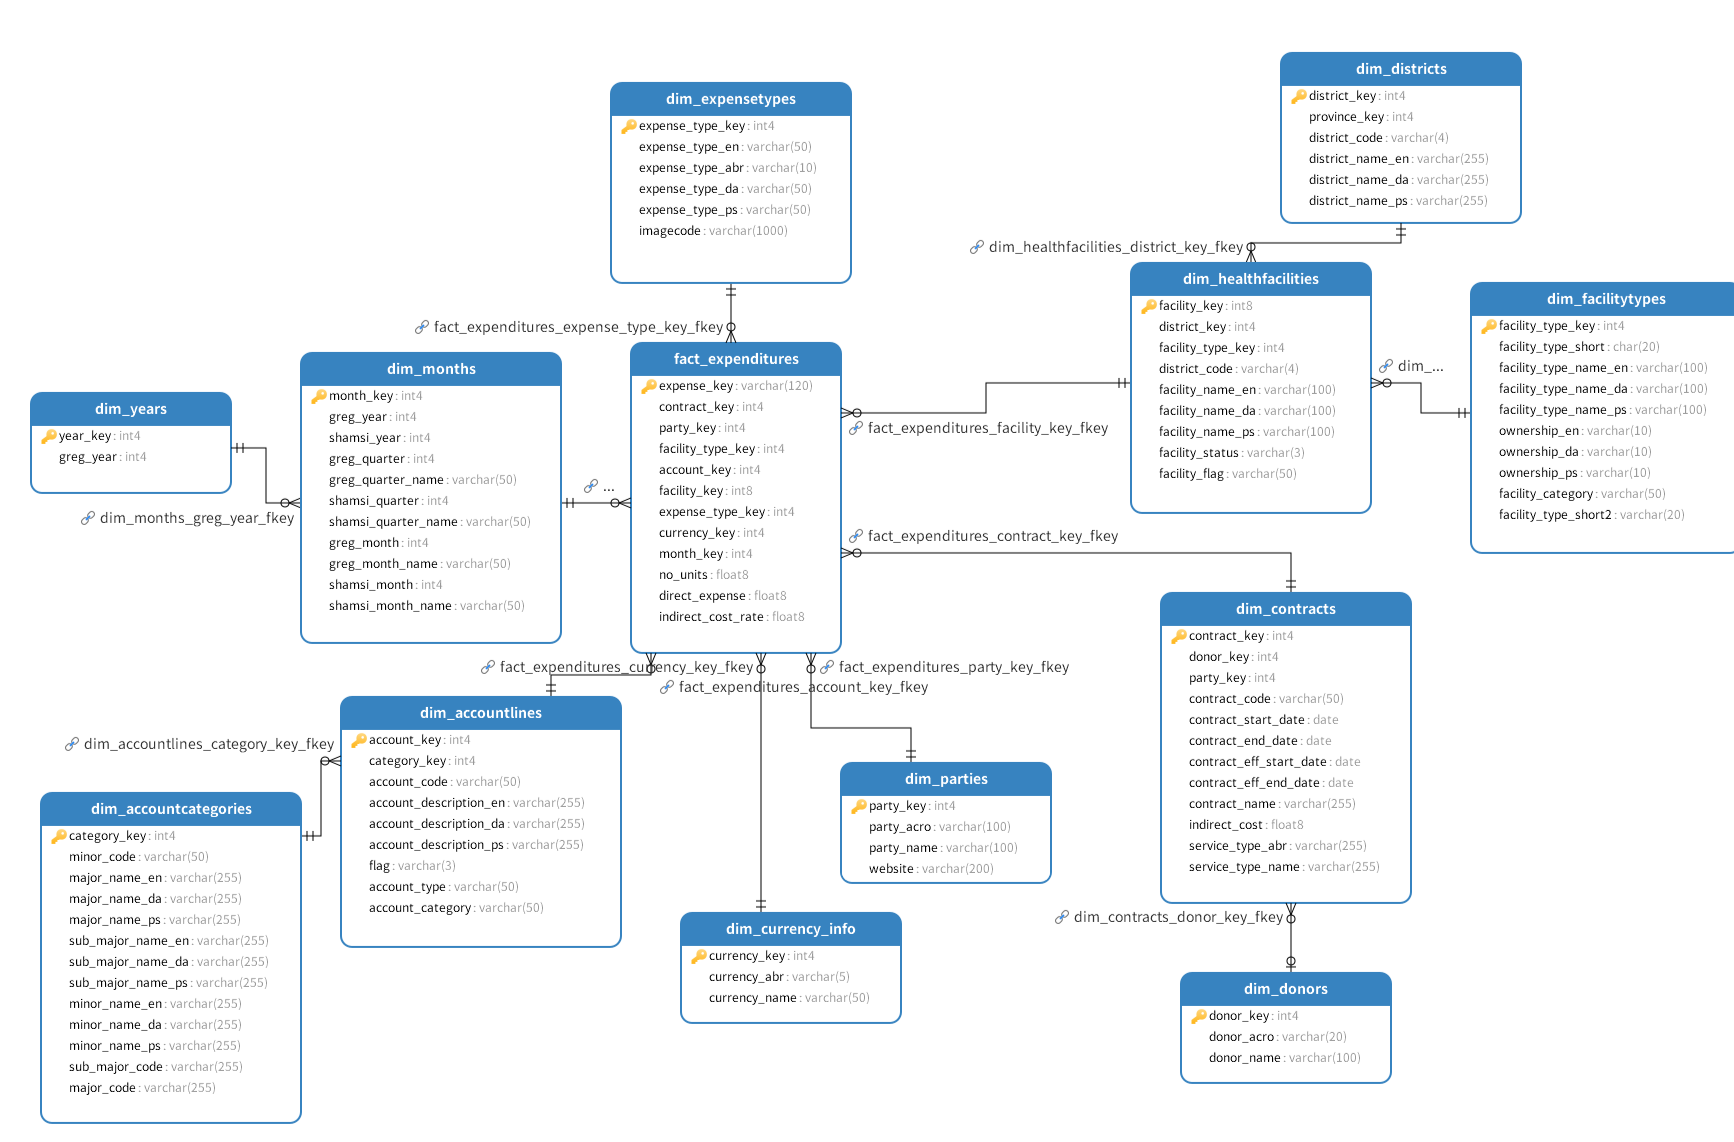
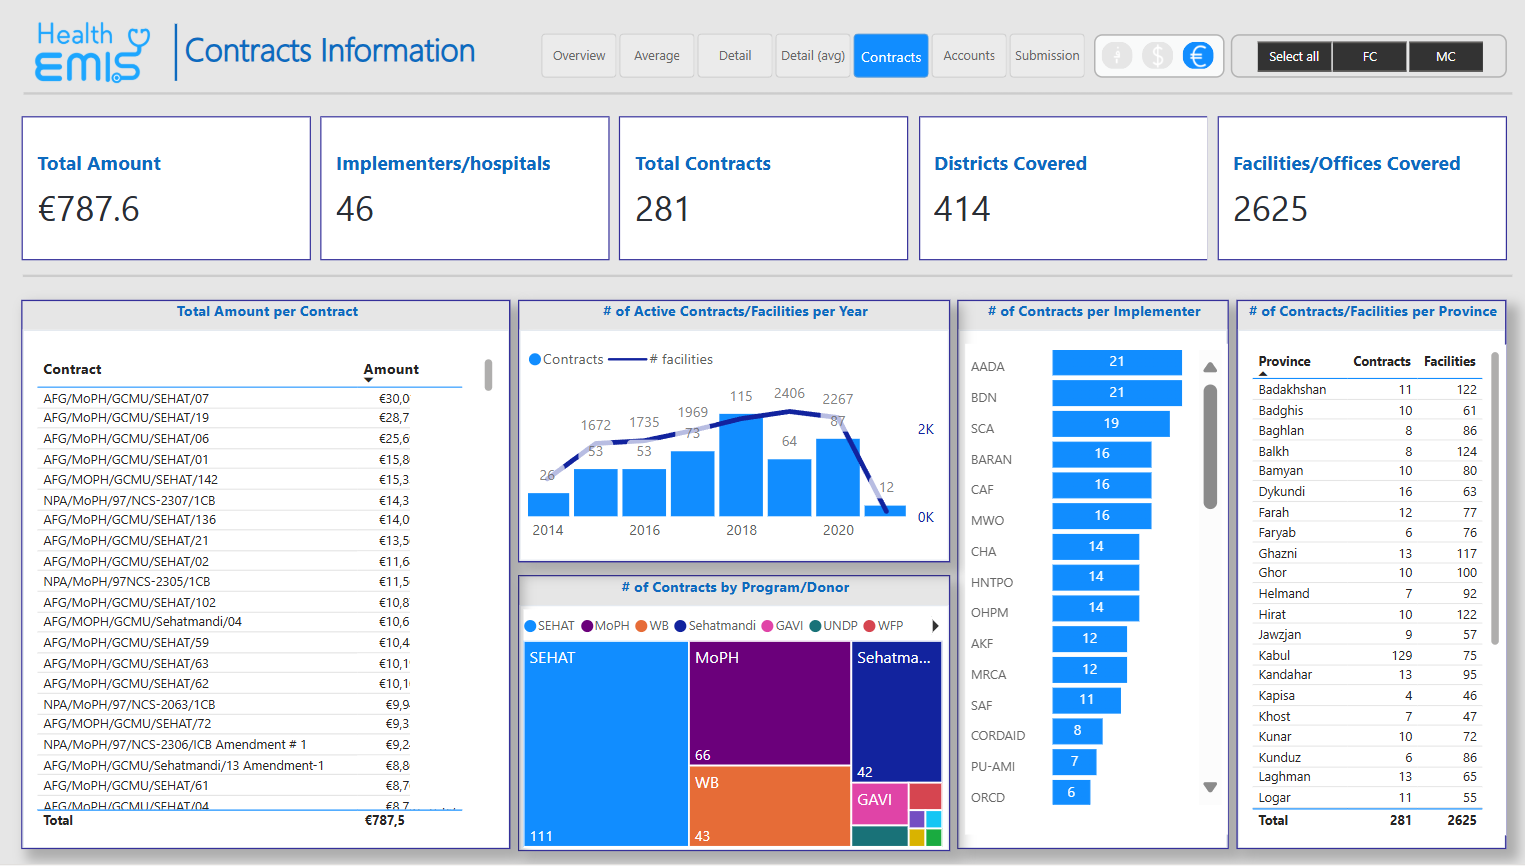
Expenditure Management Information System (EMIS) is a tool that collects contract, budget, and expenditure information related to the health sector. Originally built using Microsoft Access, EMIS produces financial reports for the MoPH and donors, ensuring transparency and accountability in health spending.
Initially implemented among NGOs involved in Basic Package of Health Services (BPHS) and Essential Package of Hospital Services (EPHS), EMIS is expanding to all health sector implementers, including line ministries and international partners. The system supports data entry, reporting, and feedback, with plans to transition to a web-based platform for broader accessibility.
Key Features of the Dashboard
- Data Integration: Consolidates data from Microsoft Access, SQL Server, and PostgreSQL to create a unified dataset.
- Data Warehouse Design: Built a scalable data warehouse using PostgreSQL to store and manage expenditure data efficiently.
- ETL Processes: Developed Custom ETL workflows to extract, stage, compare , clean, transform, and manage data changes (Slowly Changing Dimensions - SCD) using SQL and Asp.Net MVC.
- Automation: Automated ETL processes with scheduled runs and provided a user-friendly interface for managing ETL tasks.
- Row-Level Security (RLS): Implemented RLS to allow each tenant to view only their specific data, ensuring data privacy and security while saving on licensing expenses.
- Dual Dashboard Versions:
- Overall Analysis Dashboard: A version without RLS for comprehensive analysis across all data.
- Tenant-Specific Dashboard: A version with RLS implementation to restrict data access per tenant.
- Embedded PowerBI Dashboards: Integrated PowerBI dashboards into an ASP.NET MVC application, providing seamless access and enhanced user experience.
- Interactive Visualizations: Created dynamic PowerBI dashboards tailored to the needs of public health officials and donors.
- Real-Time Data Refresh: Set up automatic data refreshes in PowerBI Service using a personal gateway to ensure the dashboard always displays the latest data.
Technologies I Used
Data Warehouse | ETL Tools | Source Systems | BI & Visualization | Web Framework | Automation | Security |
![]() |
![]() ![]() |
![]() ![]() ![]() |
![]() |
![]() |
![]() ![]() |
![]() |
Steps Taken
- Data Collection: Gathered expenditure data from EMIS, which includes information from Microsoft Access, SQL Server, and PostgreSQL sources.
- Data Warehouse Design: Created a PostgreSQL data warehouse to centralize and organize the data for easy access and analysis.
- Extraction: Retrieved data from the existing Microsoft Access databases, SQL Server, and PostgreSQL sources.
- Transformation: Cleaned and transformed the data using SQL to ensure consistency and accuracy. This included:
- Data Cleaning: Removed duplicates, corrected errors, and handled missing values.
- Data Transformation: Standardized data formats and structures for uniformity.
- Slowly Changing Dimensions (SCD): Managed historical data changes to maintain data integrity over time.
- Data Aggregation: Summarized expenditure data to support high-level reporting.
- Loading: Imported the transformed data into the PostgreSQL data warehouse.
- Scheduling ETL Jobs: Wrote background jobs in Asp.Net MVC to automate the ETL process, ensuring regular data updates without manual intervention.
- User Interface: Developed an interface that allows users to trigger ETL processes as needed, providing flexibility and control.
- Power Query Integration: Utilized Power Query to connect to the PostgreSQL data warehouse, enabling efficient data import into PowerBI.
- Data Modeling: Structured the imported data to support effective analysis and visualization within PowerBI.
- Interactive Dashboards: Designed and built interactive dashboards based on user requirements, featuring:
- Expenditure Tracking: Visual representations of spending across different regions and departments.
- Donation Analysis: Insights into donor contributions and allocation.
- Trend Analysis: Identification of spending patterns and trends over time.
- Performance Analysis: Visualizations and metrics to assess the efficiency and effectiveness of health programs and expenditures.
- Dual Dashboard Versions
- Overall Analysis Dashboard: Created a comprehensive dashboard without RLS for broad data analysis.
- Tenant-Specific Dashboard: Developed a restricted dashboard with RLS to ensure each tenant accesses only their relevant data.
- DAX Formulas: Wrote DAX (Data Analysis Expressions) formulas to create calculated measures and columns, enabling advanced data analysis and dynamic calculations within the dashboards.
- Embedding Dashboards: Integrated both PowerBI dashboard versions into an ASP.NET MVC application, providing users with seamless access within a familiar web environment.
- Publishing & Refresh: Published the dashboards to PowerBI Premium service and set up automatic data refreshes using a personal gateway to ensure the data remains current.
Outcome/Impact
Provided MoPH and donors with a clear and comprehensive view of health sector expenditures.
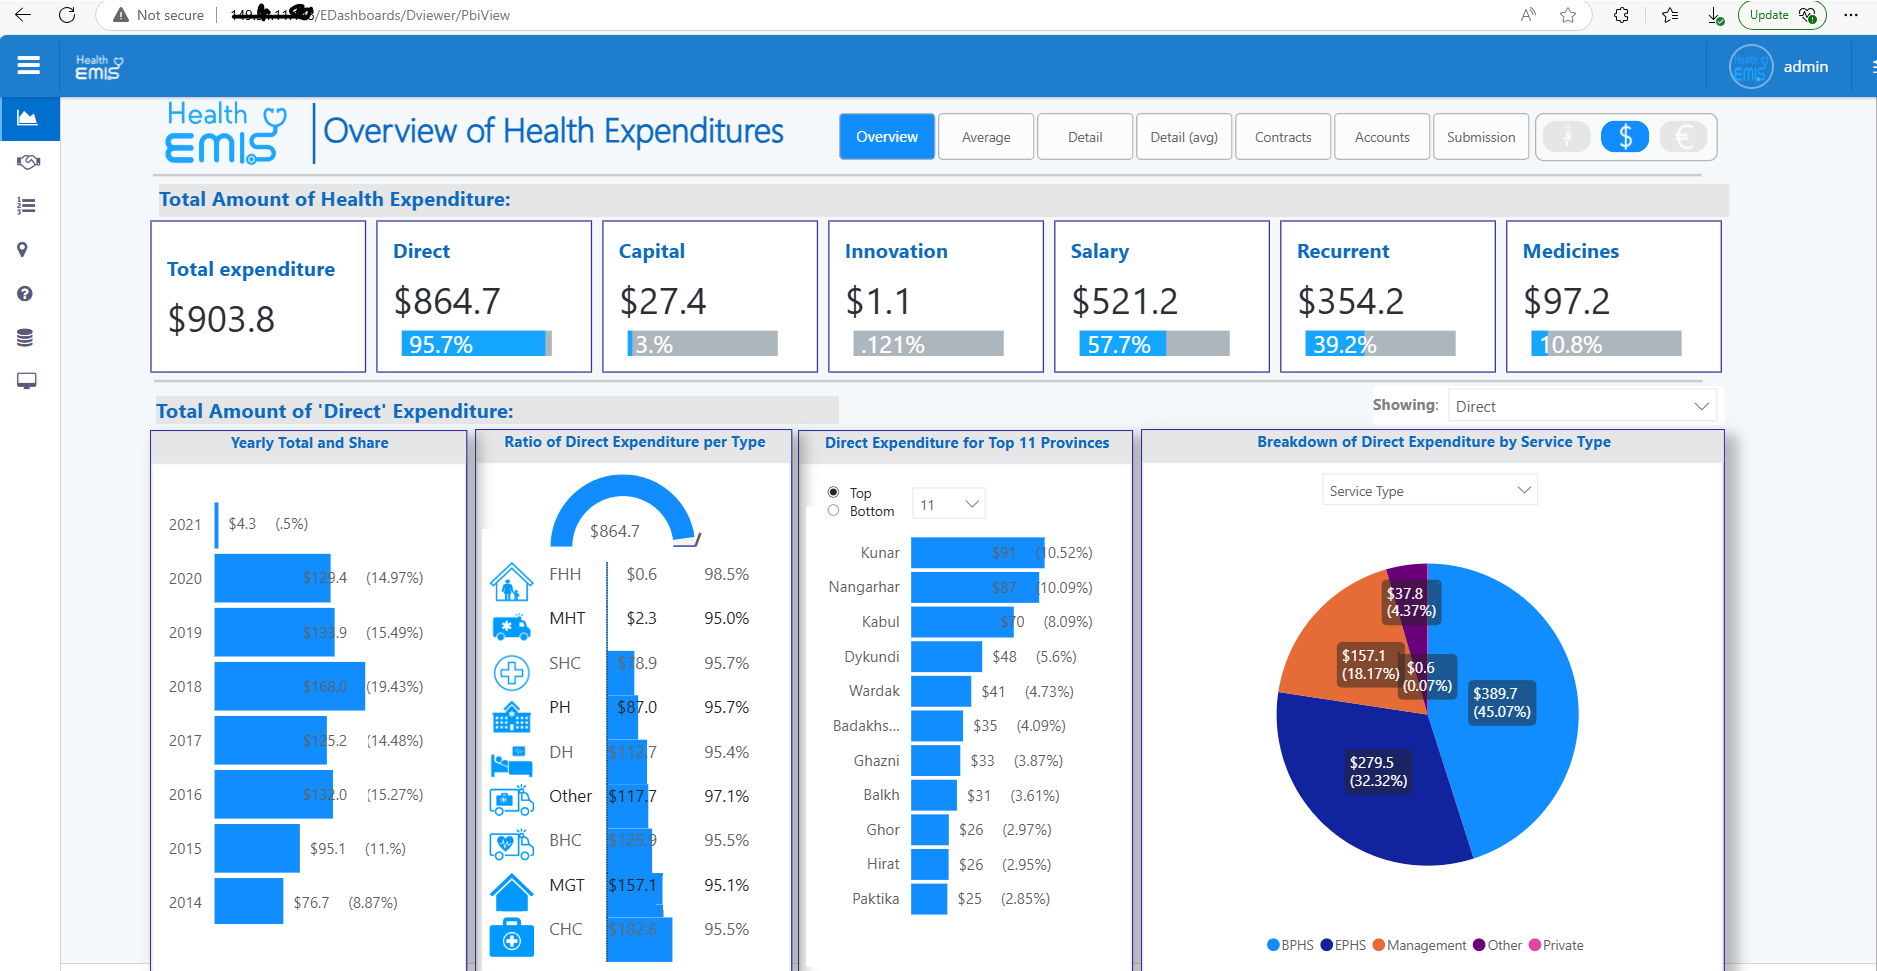
Enabled stakeholders to make data-driven decisions by highlighting key spending areas and trends.
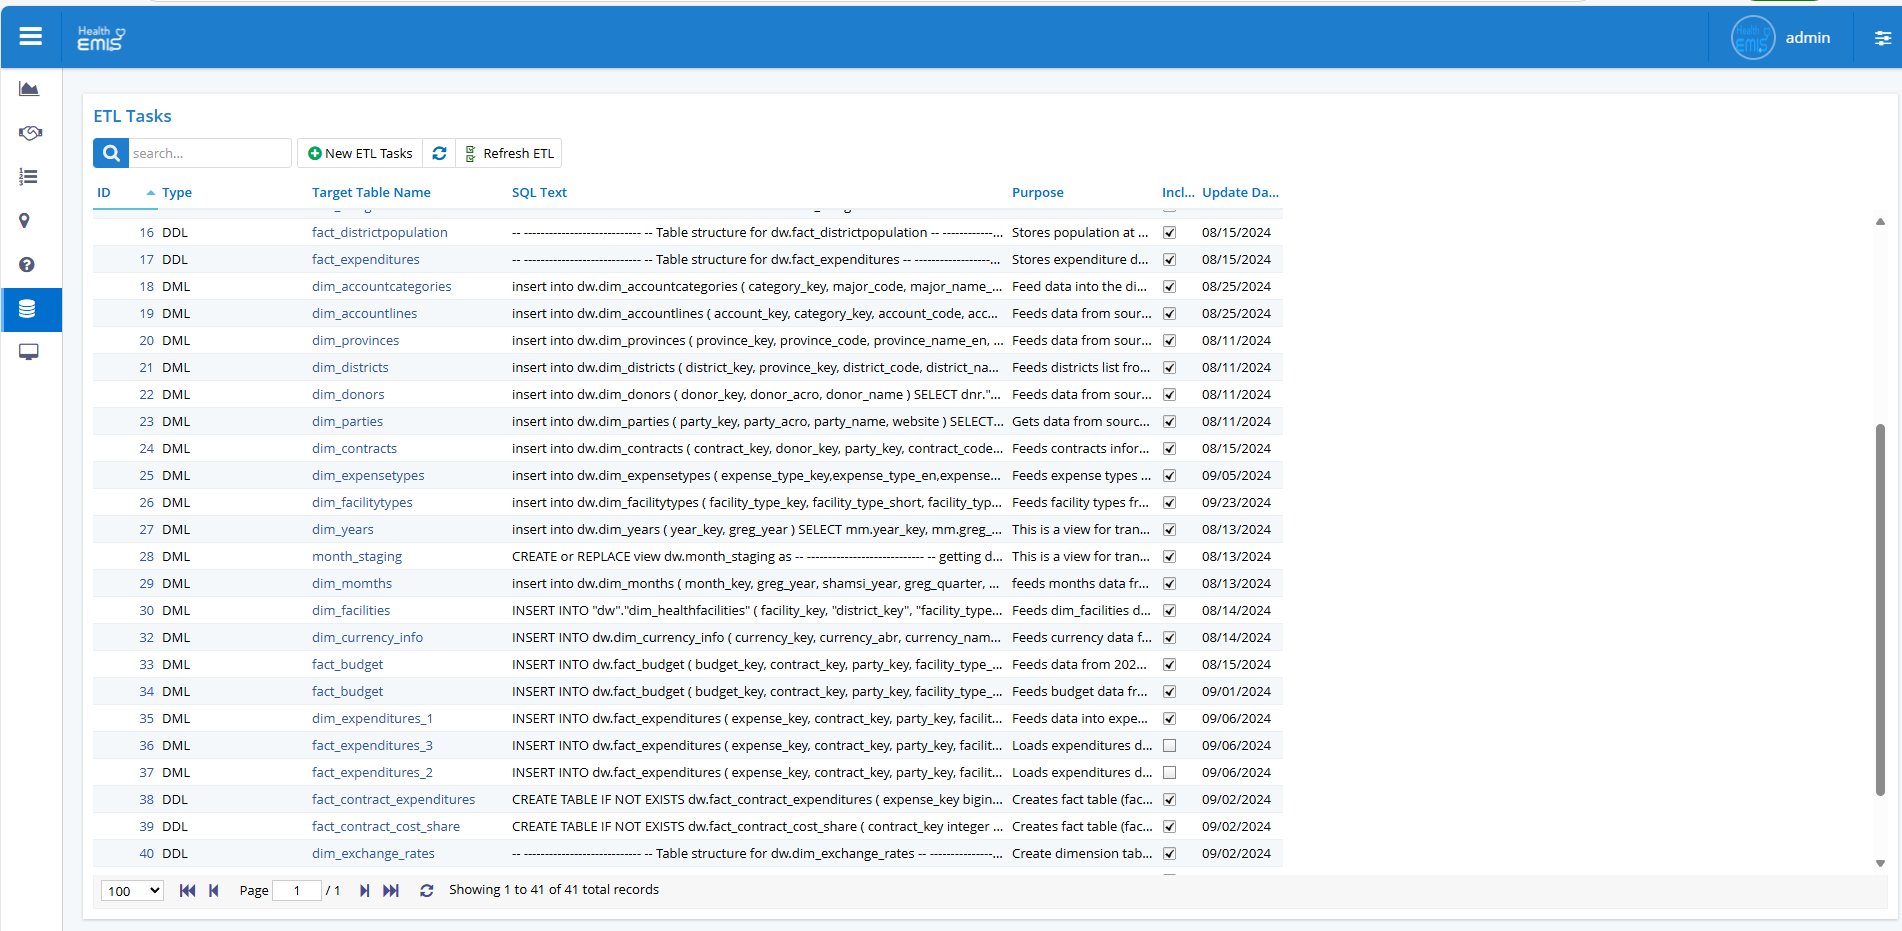
Automated data processes reduced manual effort and minimized errors, ensuring timely and accurate reporting.
Embedded PowerBI dashboards into an ASP.NET MVC application, enhancing accessibility and user satisfaction.
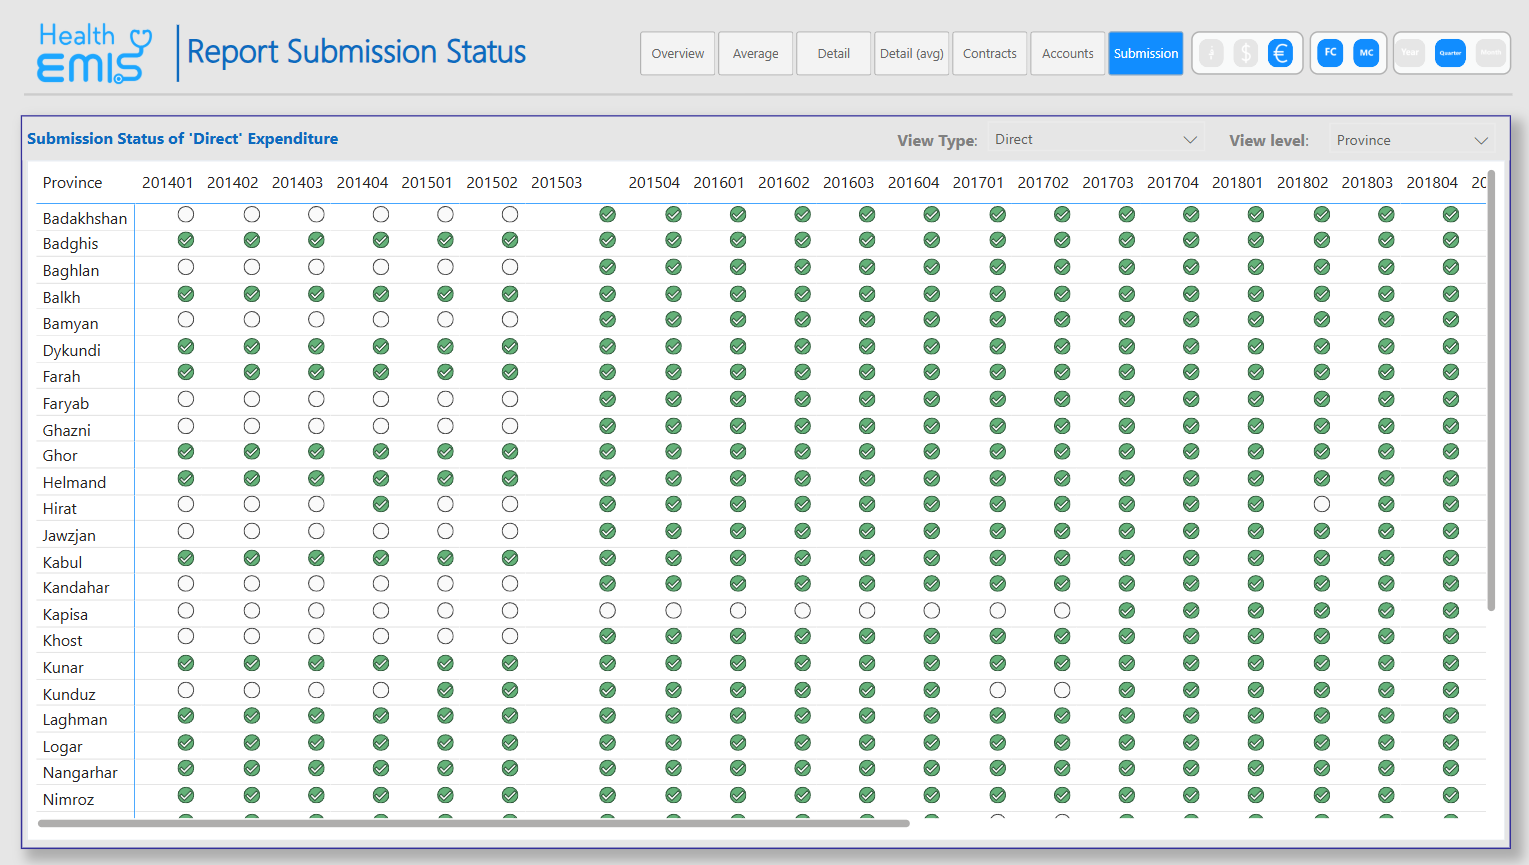
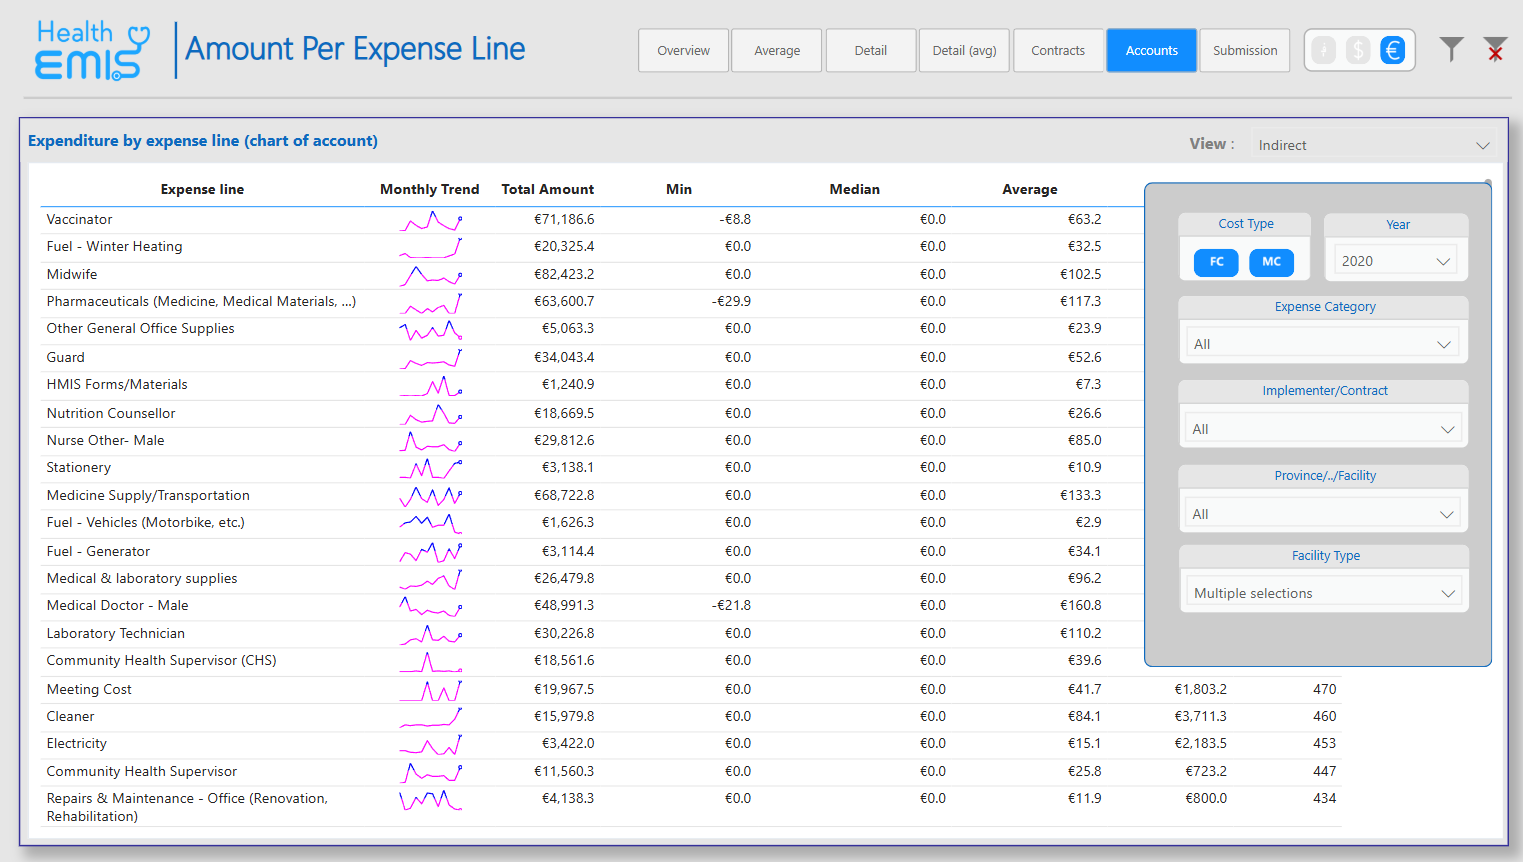
Delivered performance analysis metrics that allowed stakeholders to evaluate the effectiveness of health programs and expenditures.
Delivered a user-friendly interface and interactive dashboards that met the specific needs of public health officials and donors.
Screenshots / Demo
Technical Highlights
Designed a PostgreSQL data warehouse capable of handling large volumes of expenditure data.
Implemented automated ETL processes, enhancing reliability and reducing the need for manual intervention.
Applied RLS in PowerBI to secure data access per tenant without additional costs, ensuring data privacy and optimizing budget.
Integrated PowerBI dashboards into an ASP.NET MVC application, providing a seamless and cohesive user experience.
Set up PowerBI with a personal gateway to maintain up-to-date visualizations, supporting timely decision-making.
Performance Analysis: Developed performance metrics and visualizations to evaluate the efficiency and effectiveness of health programs and expenditures.
Performed comprehensive data modeling and wrote DAX formulas to create dynamic and insightful metrics for advanced data analysis.
Wrapping Up
This project showcases my ability to design and implement a full-scale BI solution, from data warehousing and ETL development to creating and embedding interactive PowerBI dashboards. By integrating multiple data sources, automating data processes, implementing Row-Level Security, and incorporating Performance Analysis, I provided valuable insights that support effective management and allocation of resources in the public health sector. The successful implementation of this dashboard has enhanced transparency, accountability, and informed decision-making within the MoPH and among its donors, all while optimizing costs and improving user experience.