Data Processing & Feature Engineering
1. Standardized GDP datasets from multiple sources.
2. Created new indicators like GDP growth rate, sectoral GDP contributions, and dropout rate impact scores.

This Python-based data analytics project provides an in-depth analysis of India’s GDP trends, regional economic disparities, sectoral contributions, and socio-economic relationships. The study focuses on uncovering growth trends across Indian states, identifying top-performing and struggling regions, and analyzing the link between GDP and education.
Through Exploratory Data Analysis (EDA), statistical modeling, and correlation analysis, this project delivers valuable data-driven insights and policy recommendations to support economists, policymakers, and businesses in economic planning and investment decisions.
This project applies a mix of descriptive, diagnostic, predictive, and prescriptive analytics, making it a comprehensive economic study with real-world applications.
✔ Descriptive Analytics – Summarized India’s GDP trends, growth patterns, and sector-wise contributions.
✔ Diagnostic Analytics – Explored why some states are growing faster while others are lagging.
✔ Predictive Analytics – Modeled potential economic outcomes using trend analysis and correlation modeling.
✔ Prescriptive Analytics – Provided policy recommendations based on insights from economic indicators.
📍 Overall GDP growth has slowed in recent years.
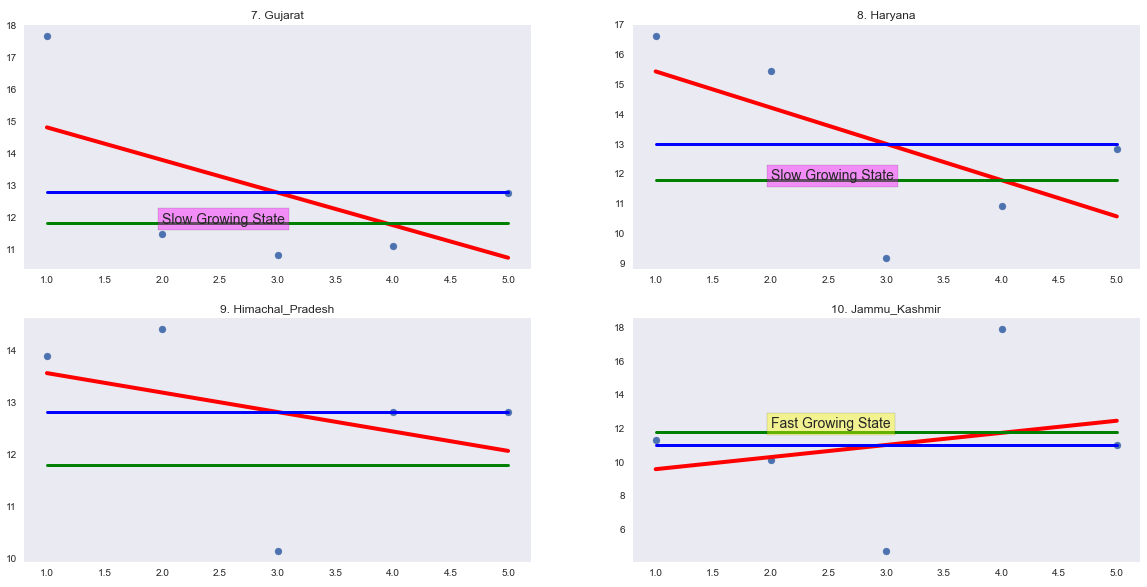
📍 Fast-growing states: Andhra Pradesh, Goa, and Jammu & Kashmir.
📍 Slow-moving states: Haryana, Odisha, and Gujarat.
📊Top 5 states have an average GSDP of ₹999,556 crore, while bottom 5 states have ₹45,111 crore.
📊 The top states' GSDP is 22 times higher than the bottom states and 2.6 times higher than the national average.
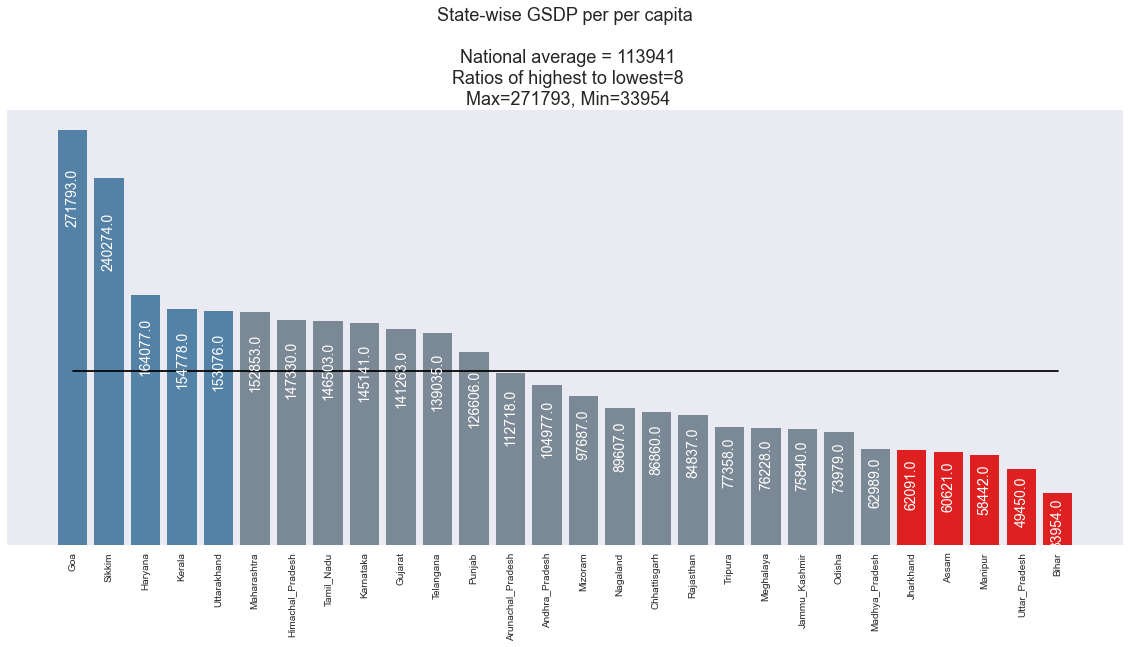
💵 Goa’s per capita income (₹271,893) is 8x higher than Bihar’s (₹33,954).
💵 28 states are above the national per capita income average of ₹113,941, while 16 states are below it.
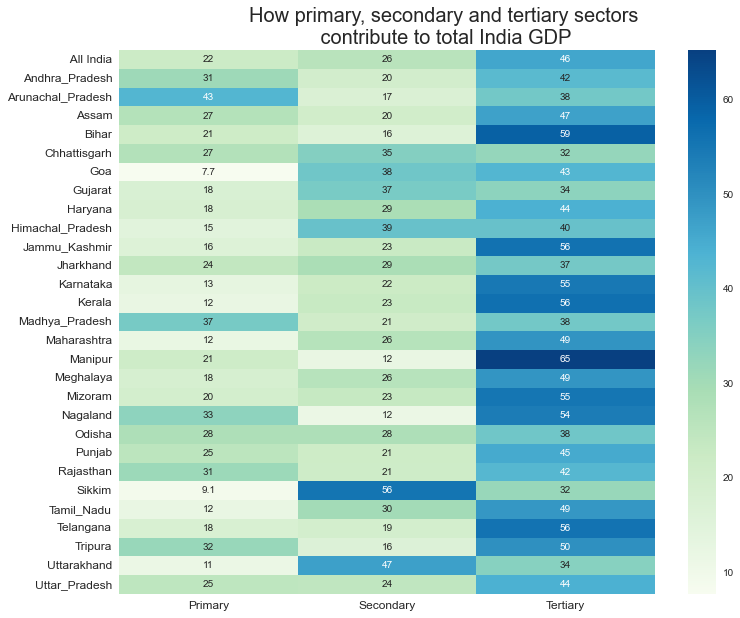
🏢 Tertiary sector contributes the most, followed by the secondary sector, while the primary sector has minimal or negative impact on economic growth.
🚜 Agriculture, Forestry & Fishing, Manufacturing, and Real Estate drive the highest economic returns.
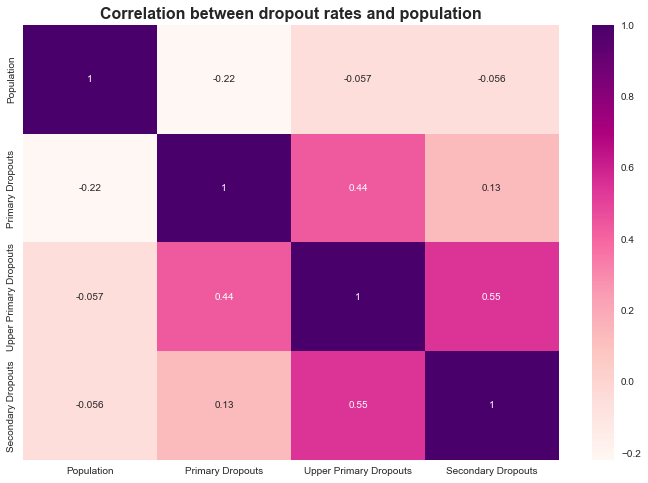
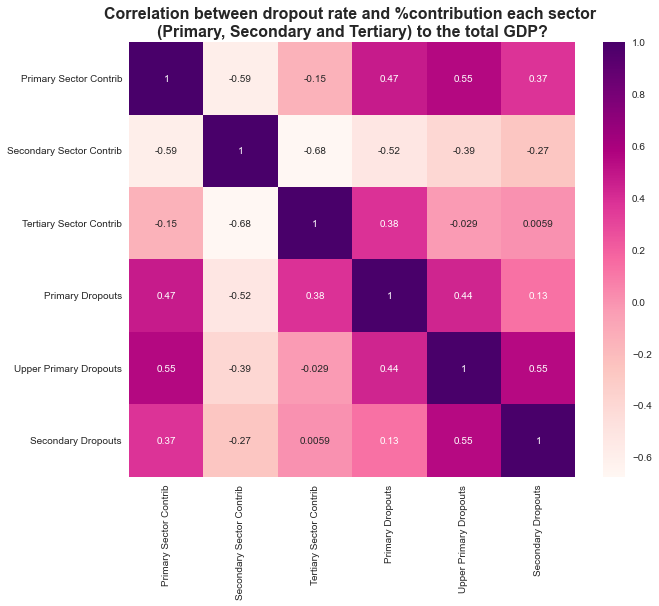
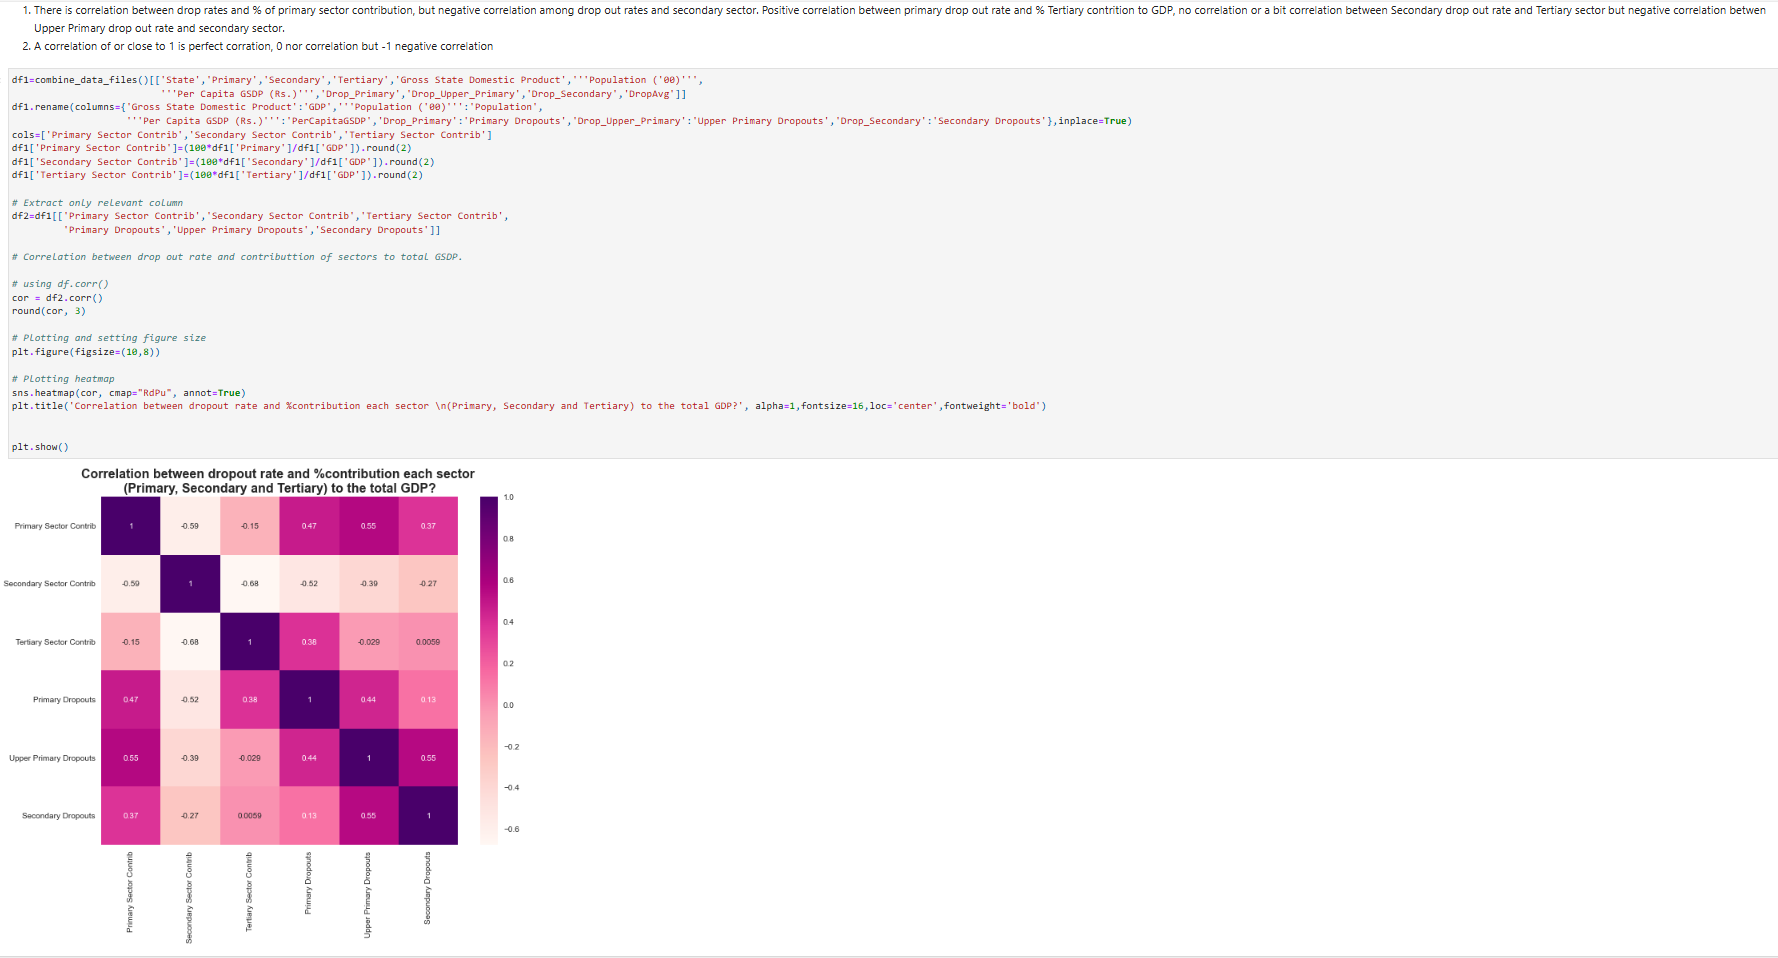
📊 Higher GDP per capita leads to lower dropout rates, proving a direct link between education and economic growth.
📊 Primary sector jobs correlate with high dropout rates, while tertiary sector jobs correlate with lower dropout rates.
📊Top states like Maharashtra and Karnataka dominate industry and services, while Bihar and Jharkhand lag behind with low industrialization.
📊 The gap in infrastructure and investment widens economic disparities, requiring targeted policy action.

1. Standardized GDP datasets from multiple sources.
2. Created new indicators like GDP growth rate, sectoral GDP contributions, and dropout rate impact scores.
1. GDP trends visualized using line charts and bar plots.
2. State-wise economic growth mapped using choropleth maps.
3. Correlation heatmaps and scatter plots used to identify key relationships.
1. Pearson correlation coefficients applied to detect economic dependencies.
2. Trend analysis performed using regression models.
📊 GDP Growth Trends (Line Charts)
🌍 State-wise Economic Disparities (Choropleth Maps)
📈 GDP Per Capita Comparisons (Bar Charts)
📉 Dropout Rates vs. GDP Per Capita (Scatter Plots)
🔍 Sectoral Contributions to GDP (Stacked Bar Charts)
✅ Python for Data Analysis (Pandas, NumPy)
✅ Exploratory Data Analysis (EDA) & Feature Engineering
✅ Data Visualization (Matplotlib, Seaborn, Plotly)
✅ Statistical Analysis (Pearson Correlation Analysis)
✅ Data Cleaning & Transformation
This project showcases my expertise in economic data analytics, statistical modeling, and data visualization. The insights provide valuable recommendations for policymakers, economists, and business leaders, helping to shape sustainable economic policies and investment strategies for India's future.