Comprehensive Data Review
Managed the review of 12 Excel datasets with 71 individual sheets and a narrative report to extract valuable insights.

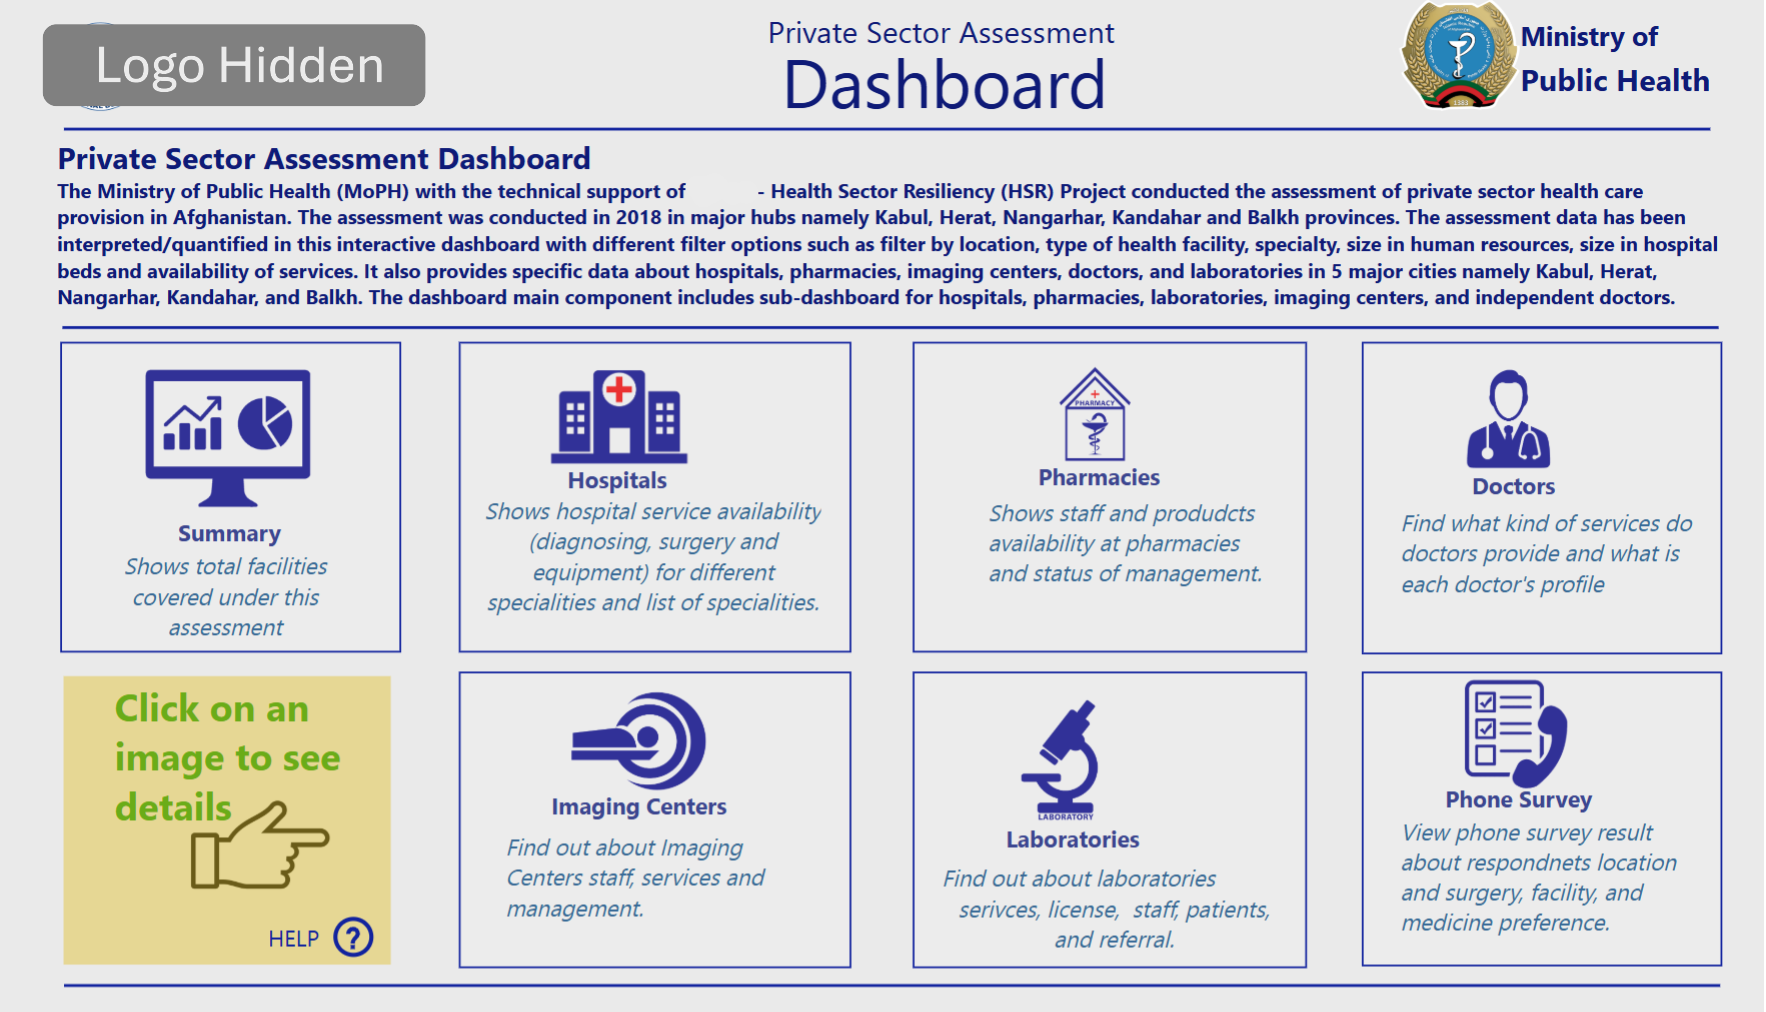
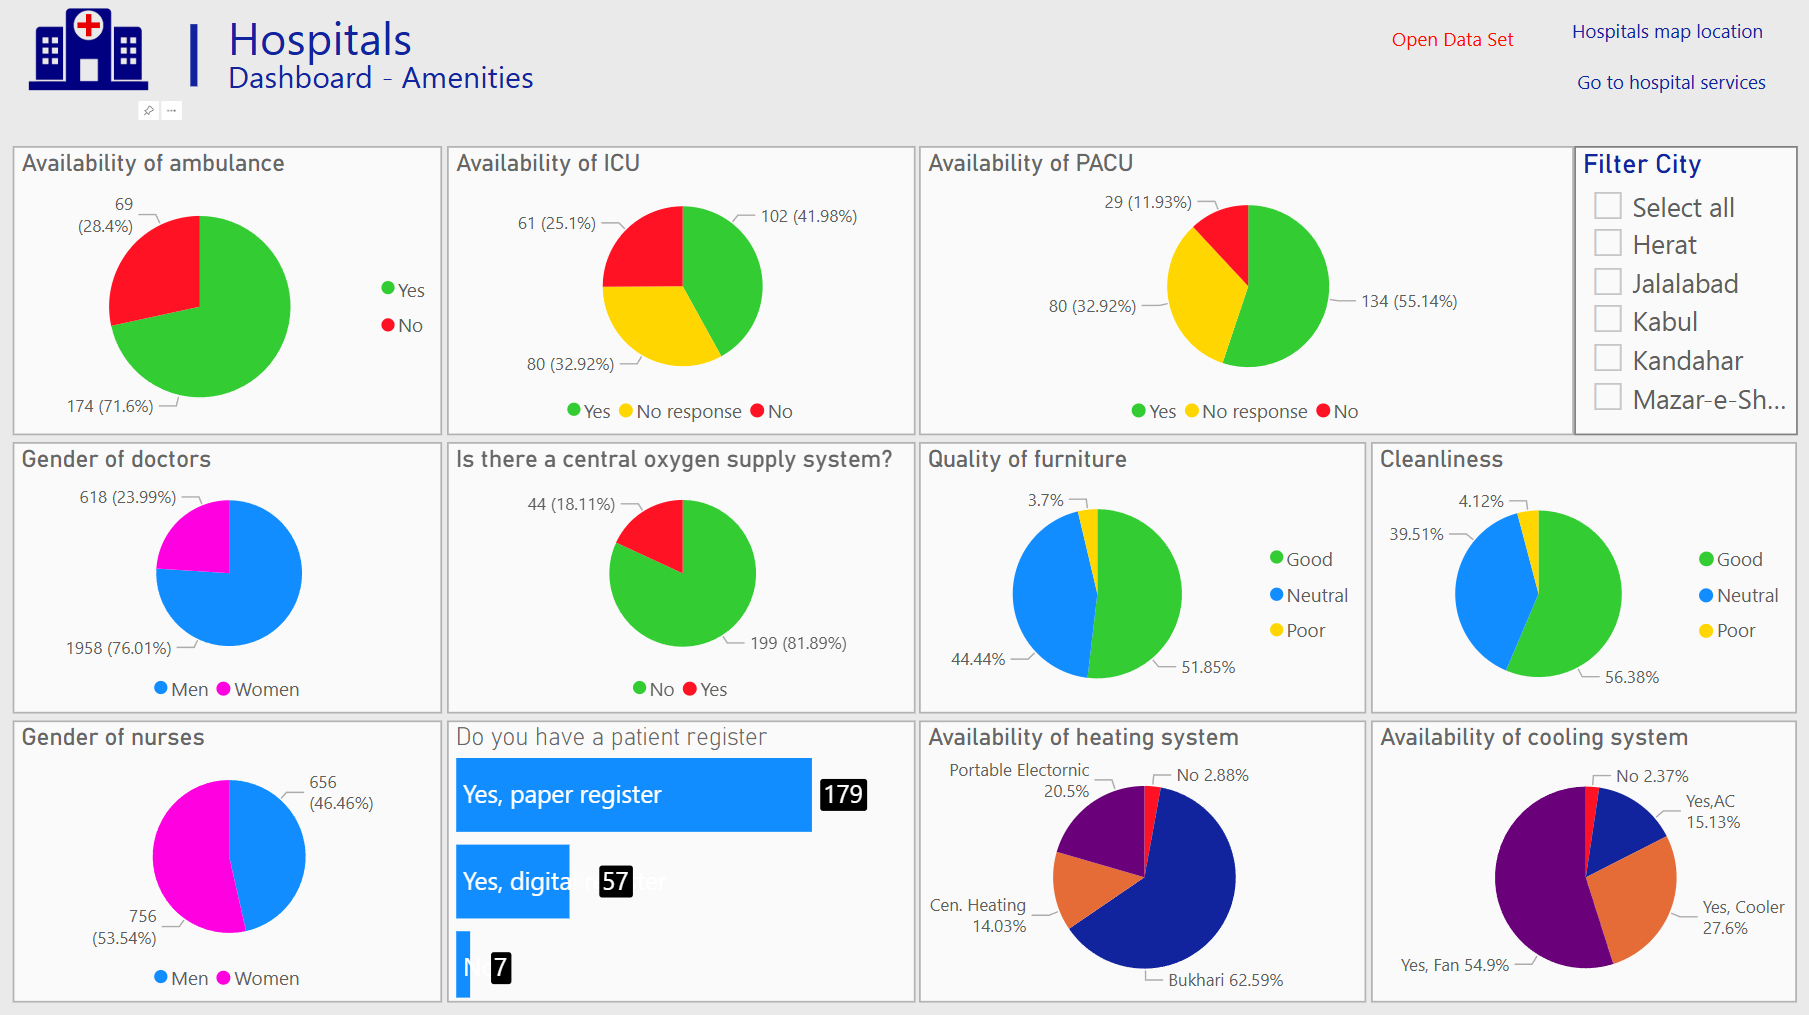
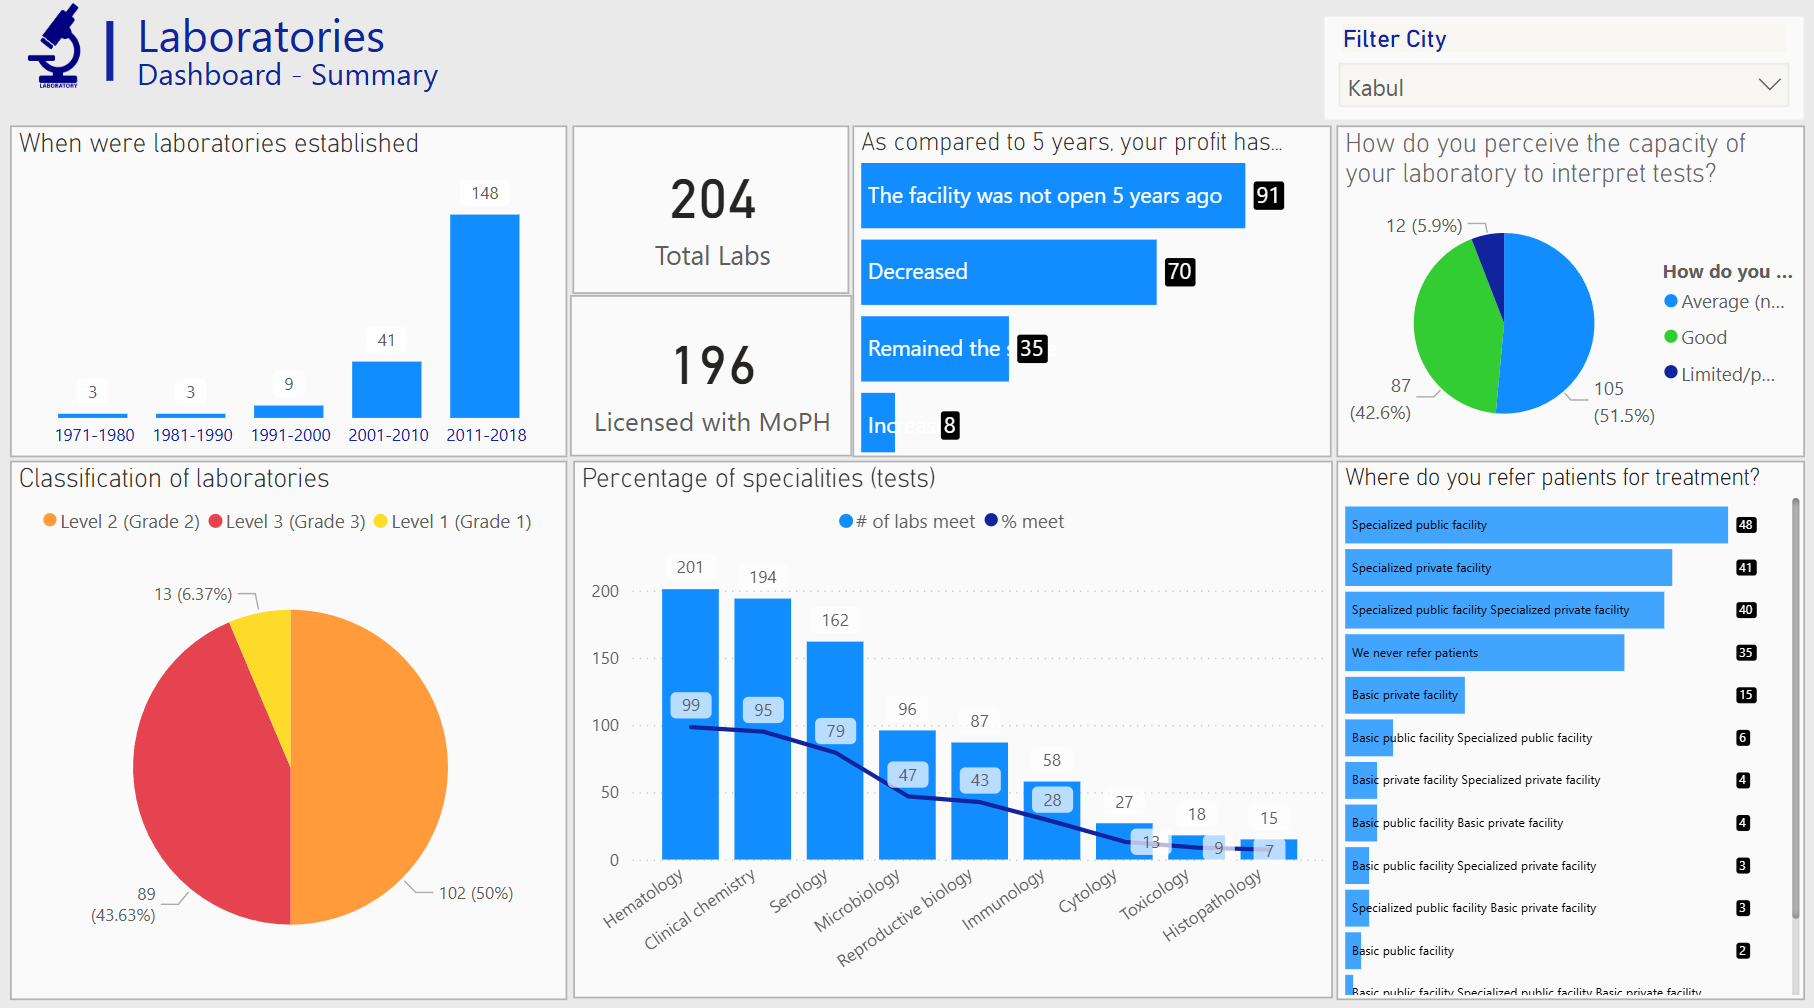
Developed an interactive Power BI solution that leverages data from thousands of hospitals, pharmacies, and other private-sector health providers to help end users analyze and uncover investment opportunities. The dashboard enables stakeholders to drill down into key metrics by filtering data based on location, facility type, specialization, human resource size, hospital bed capacity, and service availability. The project focused on five major provinces and includes sub-dashboards for hospitals, pharmacies, laboratories, imaging facilities, and independent doctors. The primary objective was to identify and quantify investment opportunities in the private health sector and provide investors with a tool to efficiently explore these opportunities.
I was assigned to review datasets in 12 Excel datasets, which included 71 individual Excel sheets from a comprehensive survey, accompanied by a detailed narrative report. This extensive review process was critical to extracting valuable insights and establishing the foundational metrics and KPIs for the analysis. By thoroughly analyzing the raw data and contextual information provided in the narrative report, I was able to identify key performance indicators essential for assessing investment opportunities in the private health sector.
In-Depth Data Review & Metric Identification:
Conducted a thorough review of the 12 Excel datasets (comprising 71 sheets) and the narrative survey report, and held several stakeholder meetings to identify and define critical metrics and KPIs that guide investment analysis.
Data Cleaning & Modeling:
Utilized Excel and Microsoft Access for data cleaning, aggregation, and modeling to prepare the raw survey data before importing it into PowerBI.
Dashboard Development:
Designed and built an interactive PowerBI solution that offers detailed filtering options including location, type of facility, specialization, human resource size, hospital bed size, and service availability.
Comprehensive Reporting:
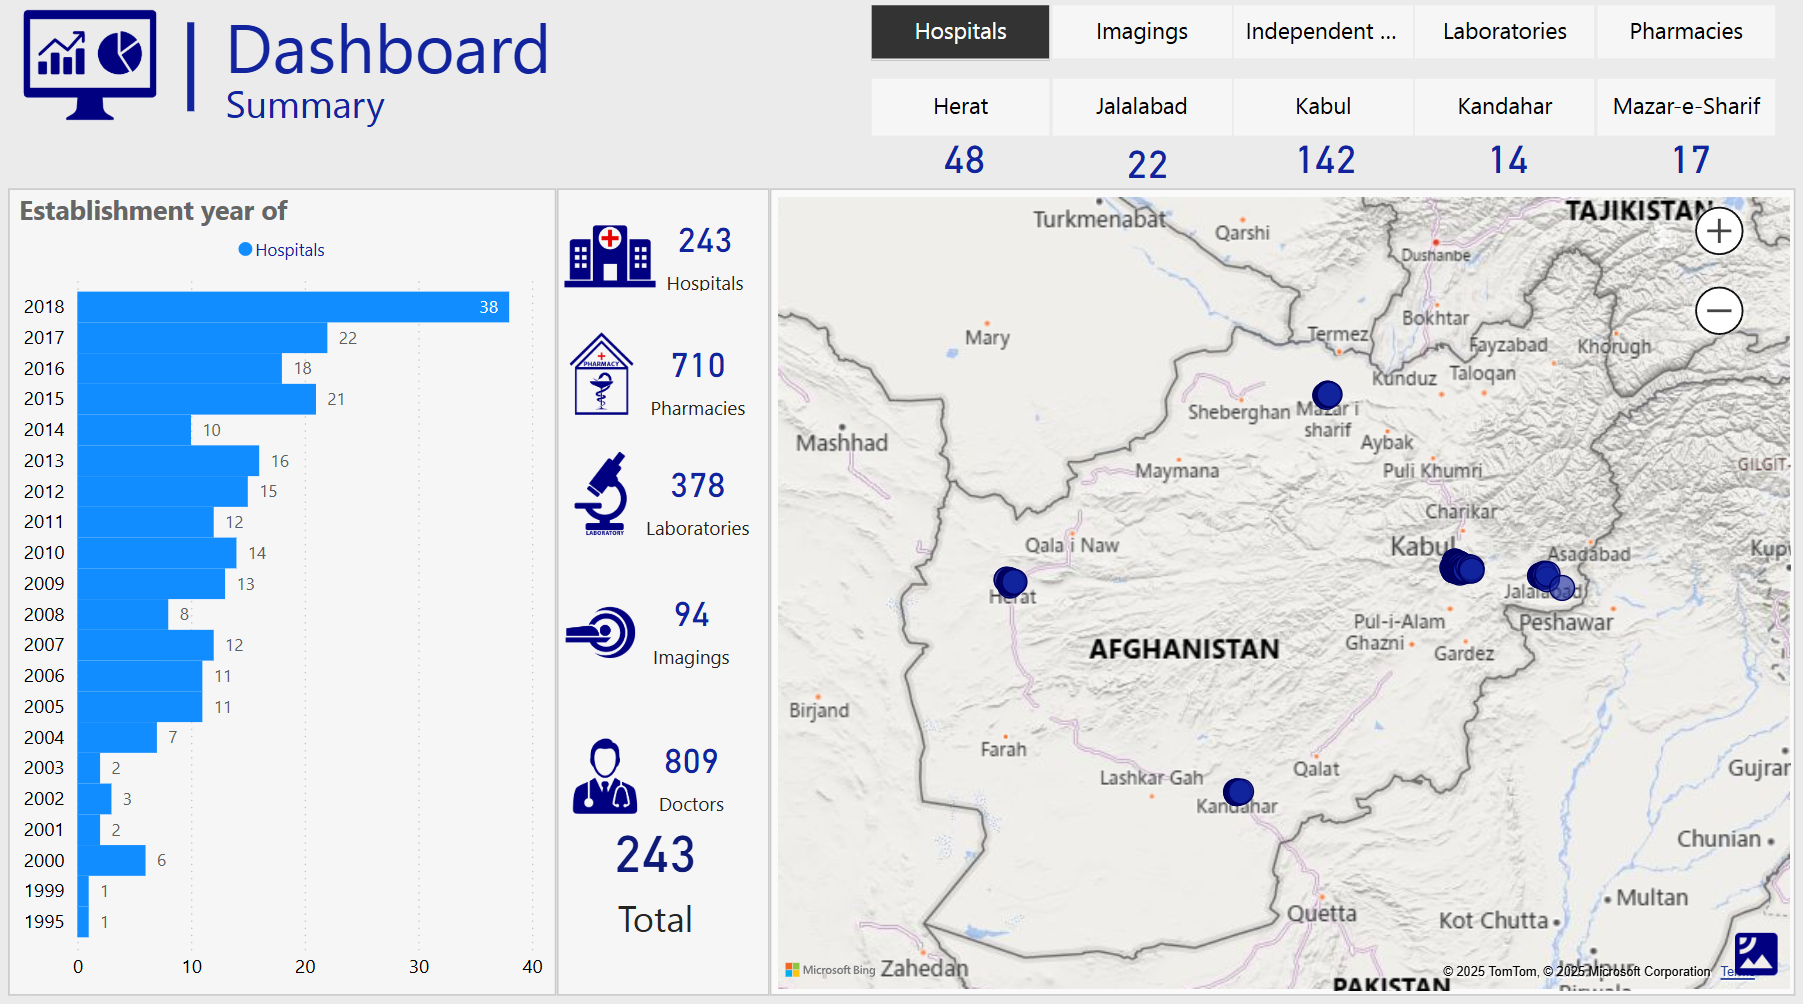
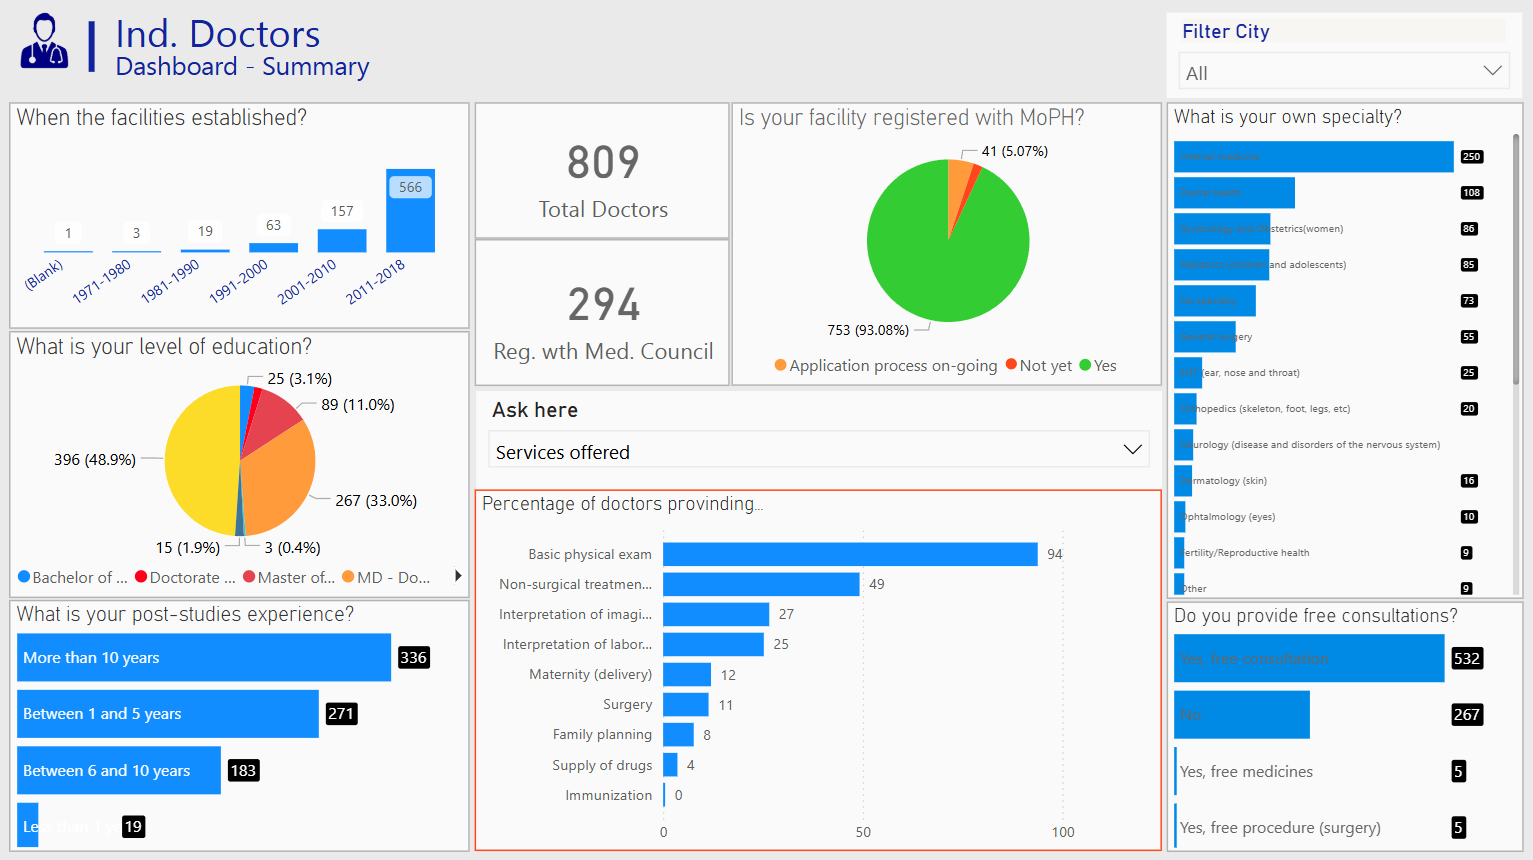
Developed 7 distinct dashboards across 33 report pages, with dedicated sub-dashboards for hospitals, pharmacies, laboratories, imaging facilities, and independent doctors.
Deployment & Presentation:
Published the report from PowerBI Desktop to the PowerBI Service and presented the final interactive solution to end users.
Metric and KPI Identification:
Defined and implemented critical metrics and key performance indicators (KPIs) through a thorough review of 12 Excel datasets (including 71 individual sheets) and a detailed narrative report, coupled with stakeholder requirement gathering.
Data Integration and Cleaning:
Consolidated and cleaned data using Excel and Microsoft Access, ensuring the creation of a unified and high-quality dataset.
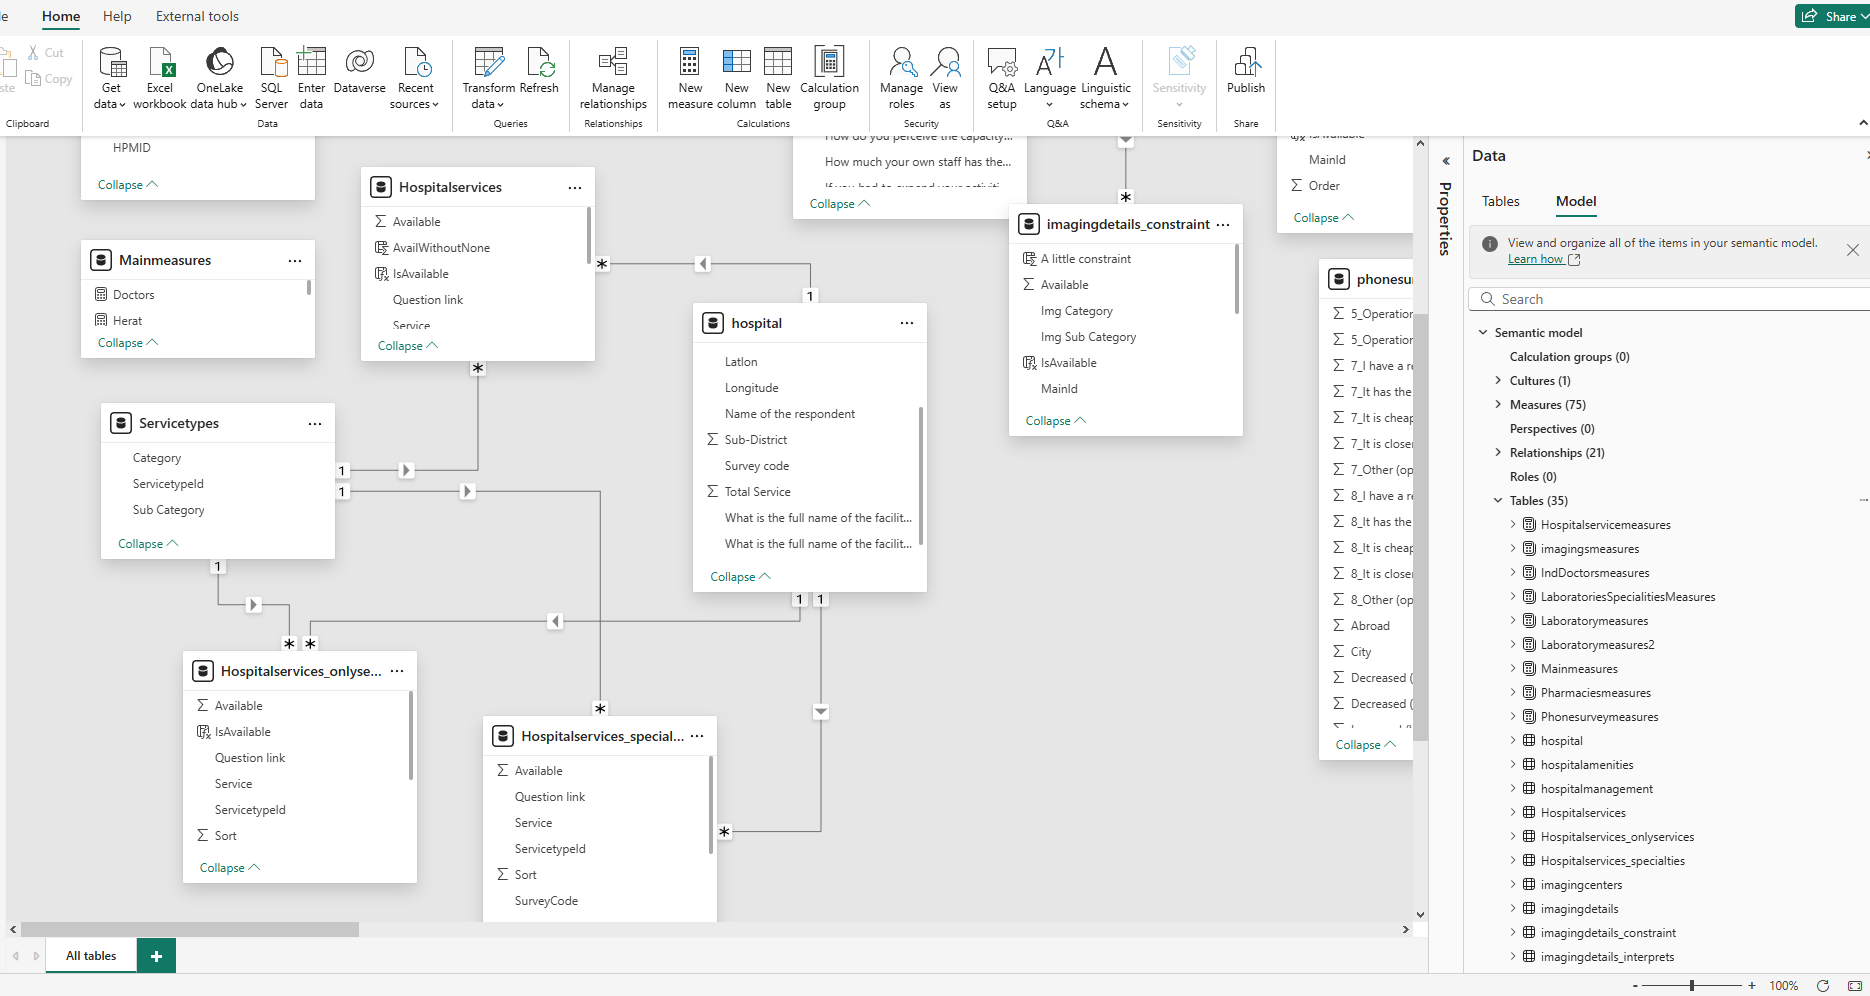
Data Modeling:
Utilized Power Query to model the integrated data effectively, preparing it for in-depth analysis and visualization.
Interactive Visualizations:
Created dynamic PowerBI dashboards tailored to the specific needs of stakeholders, offering detailed insights through interactive reports and visuals.
Publishing on PowerBI Service:
Published the final dashboards to the PowerBI Service, making them easily accessible to end users.
| Data Cleaning and Modeling | ETL & Data Transformation | BI & Visualization | Data Integration |
Enabled investors and decision-makers to analyze private-sector health services and identify high-potential investment opportunities.
Provided stakeholders with detailed insights into health facilities across various dimensions such as location, specialization, and capacity.
Empowered users to make informed decisions through comprehensive, interactive visualizations.
Met and exceeded user requirements by delivering a robust, multi-faceted BI solution.
Managed the review of 12 Excel datasets with 71 individual sheets and a narrative report to extract valuable insights.
Leveraged Excel and Access for high-quality data preparation.
Utilized Microsoft Access and Power Query for effective data integration into PowerBI.
Defined critical metrics and developed calculated measures using DAX.
Developed 7 dashboards spanning 33 pages with rich filtering and drill-down capabilities.
Successfully published the solution to PowerBI Service and presented an impactful solution to end users.
The Health Investment Insight Dashboard project is a testament to my ability to turn complex, multi-source survey data into an actionable BI solution. Through meticulous data review, identification of key metrics, and robust dashboard development, I enabled stakeholders to uncover investment opportunities in the private health sector. This project highlights my technical proficiency and commitment to delivering user-centric, data-driven solutions.