Collaborated with UNICEF information specialist to define and implement critical metrics and KPIs, ensuring the dashboard meets user needs.
Nutrition Services Analytics Dashboard
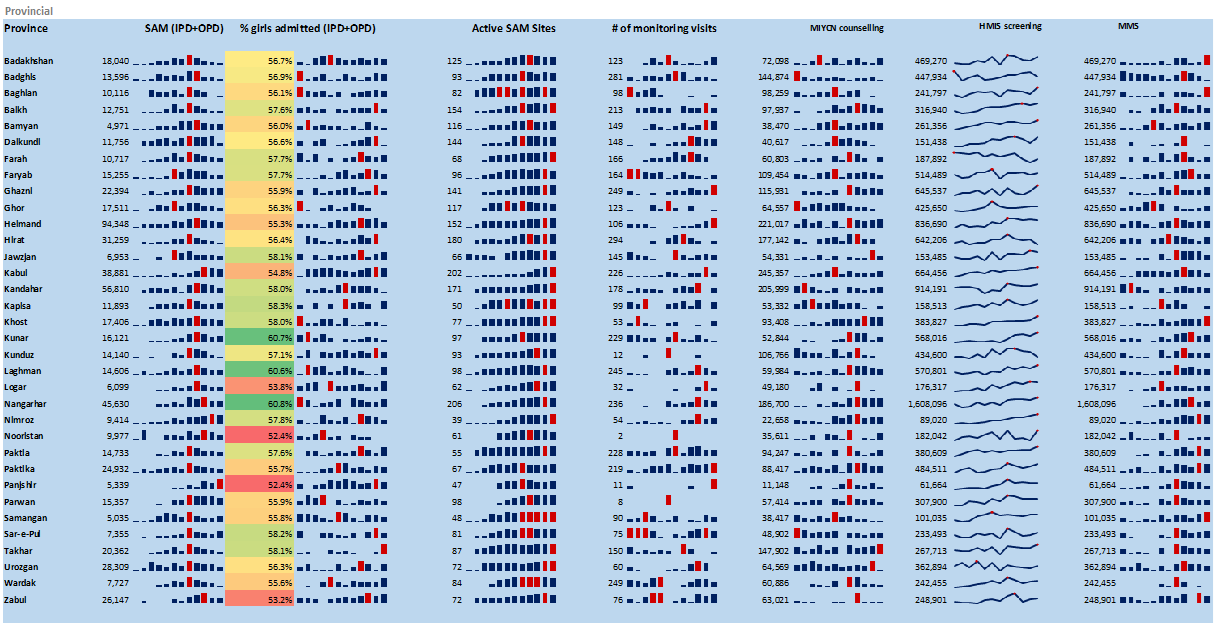
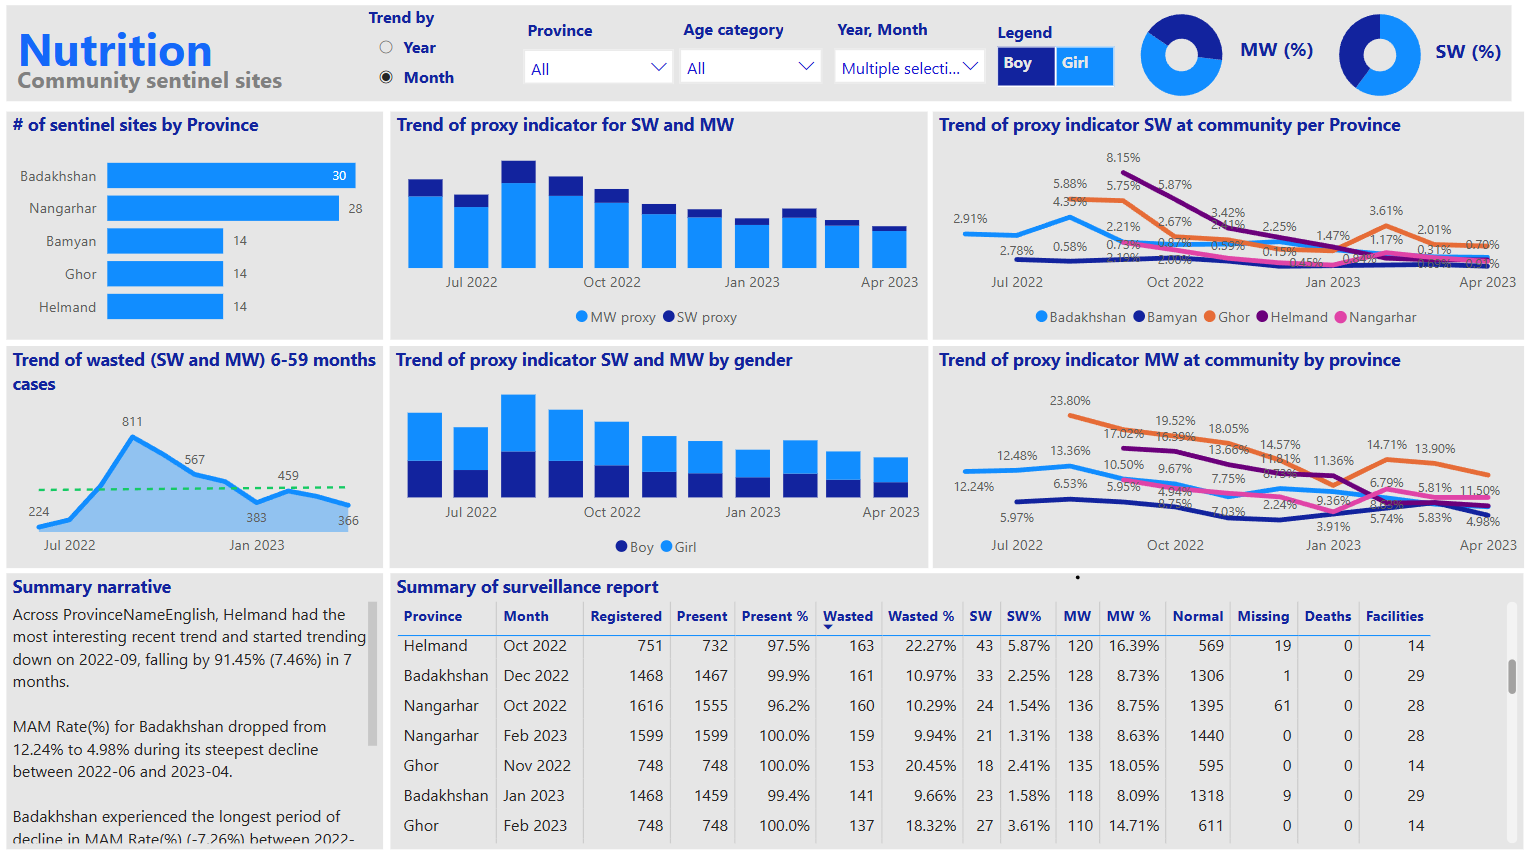
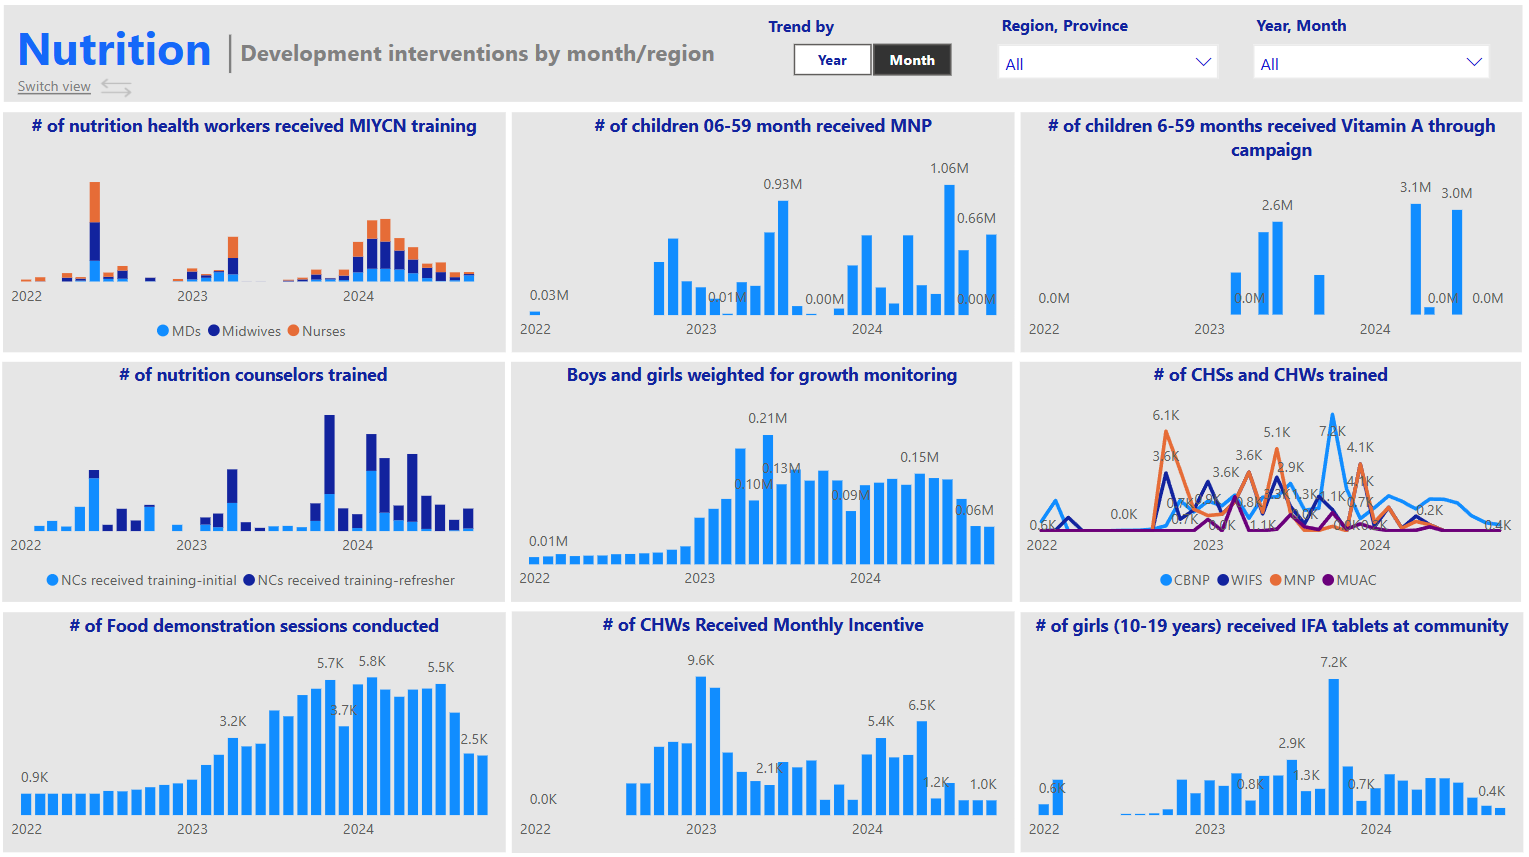
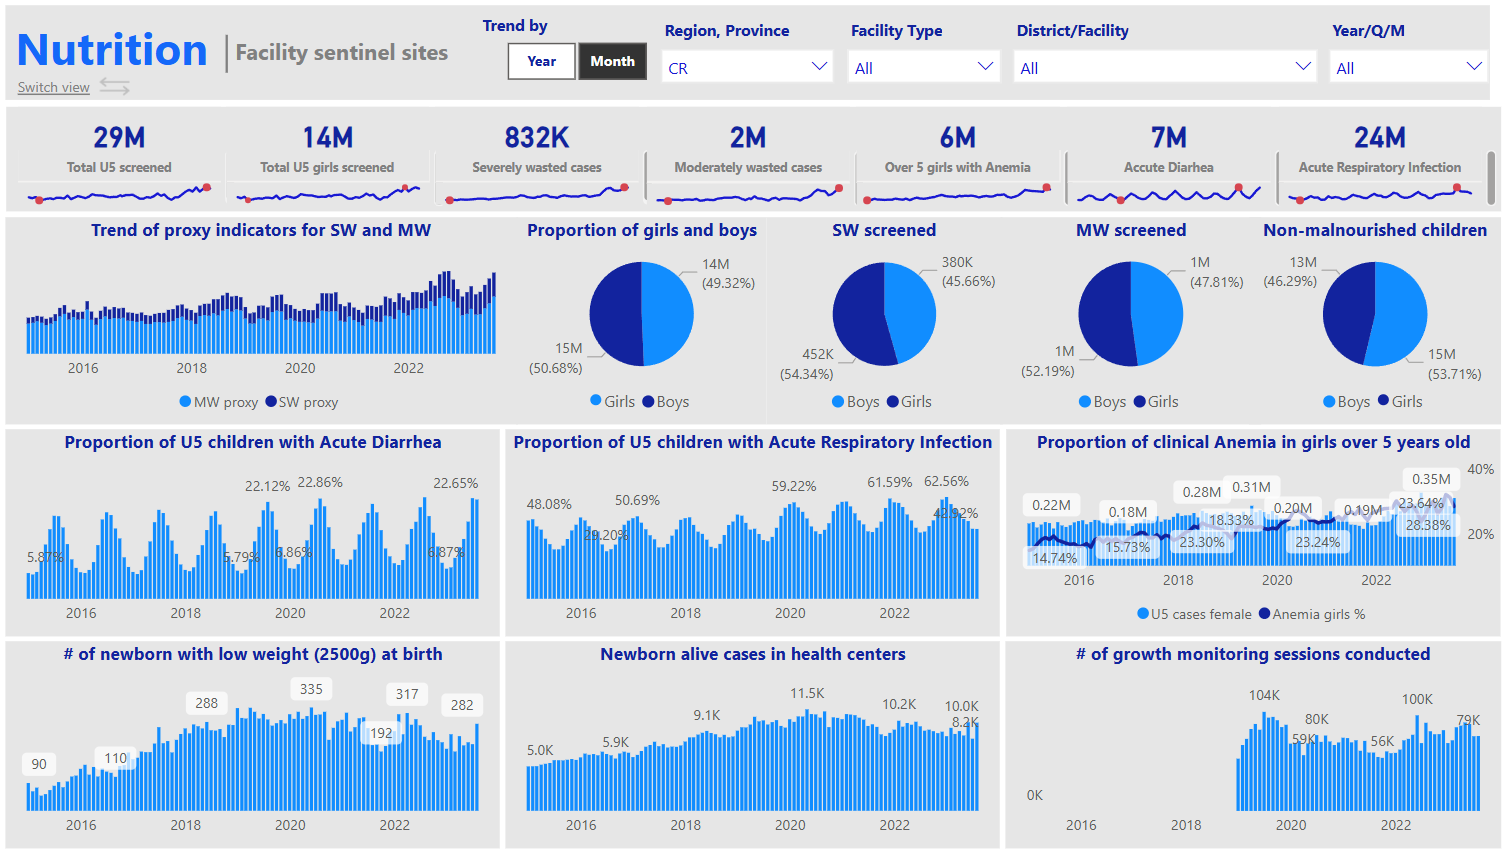
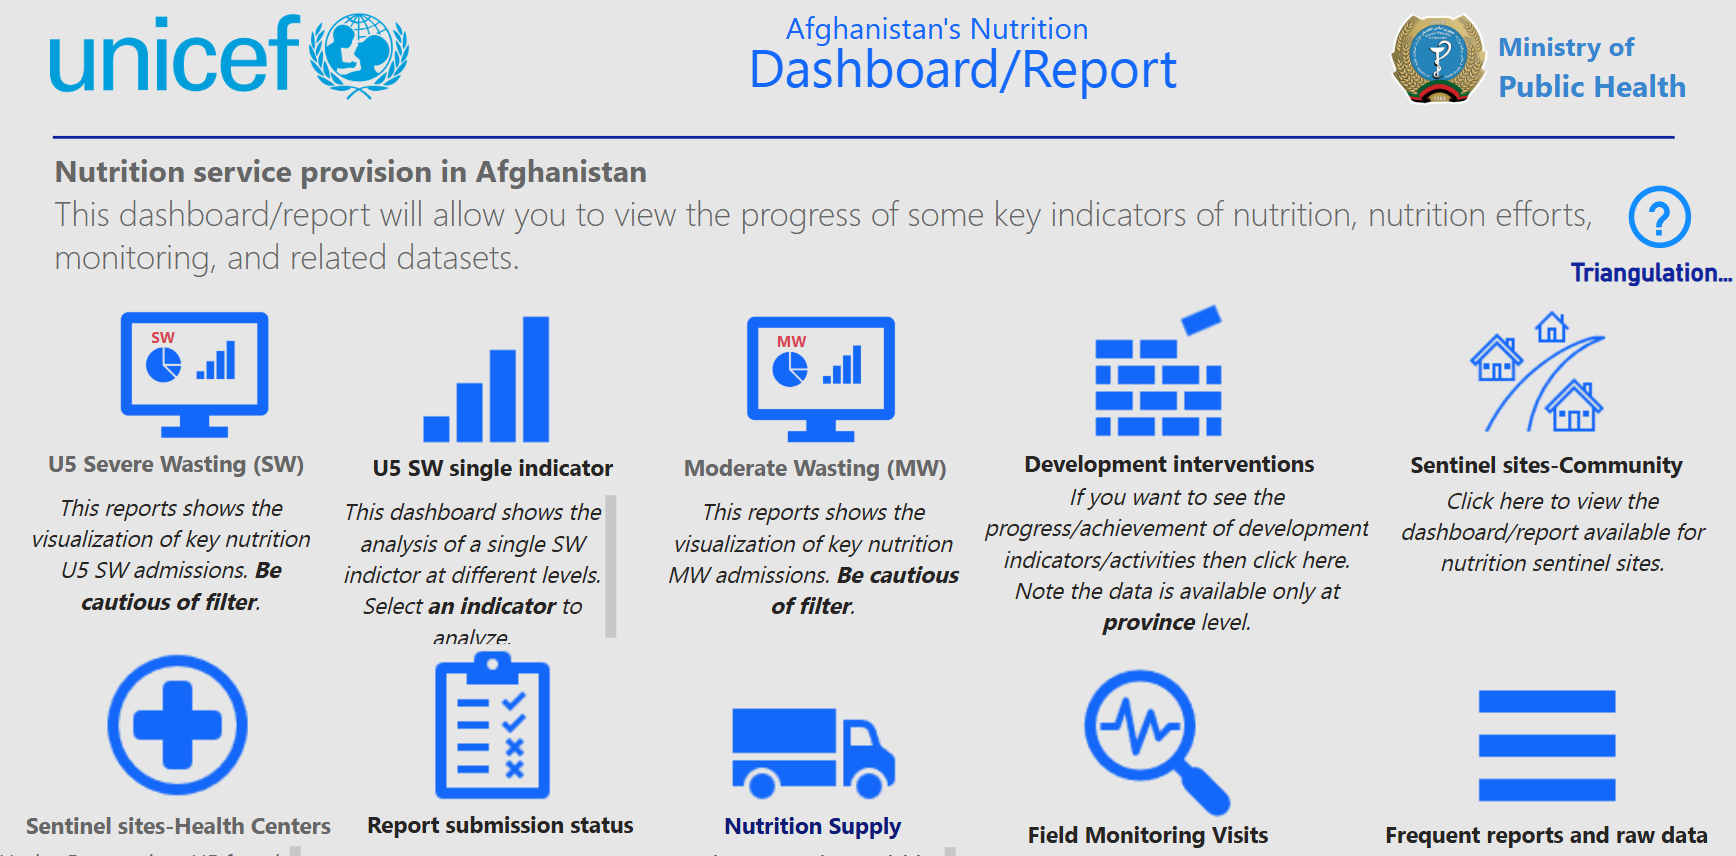
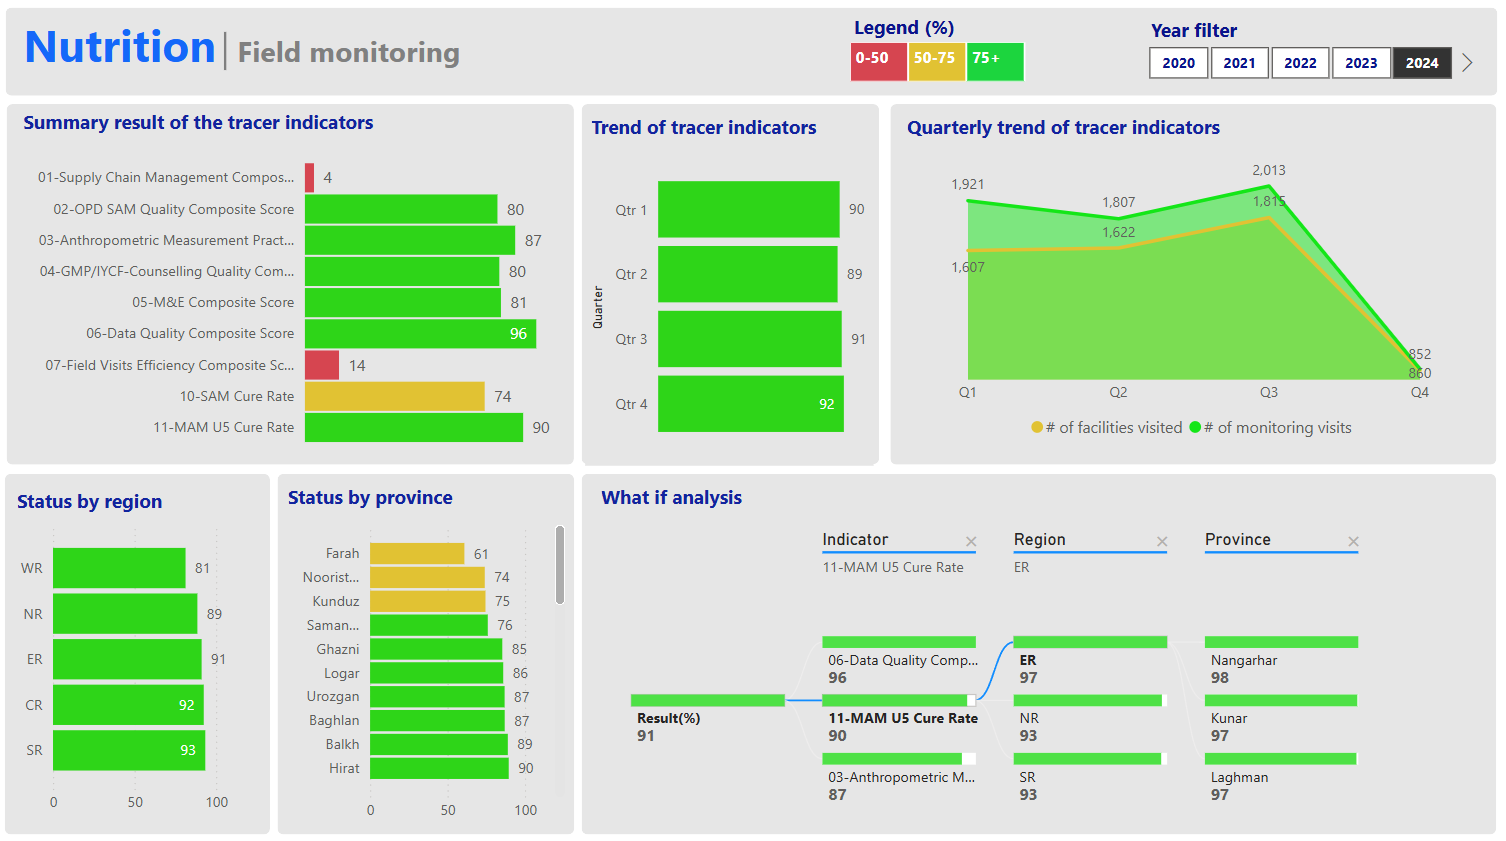
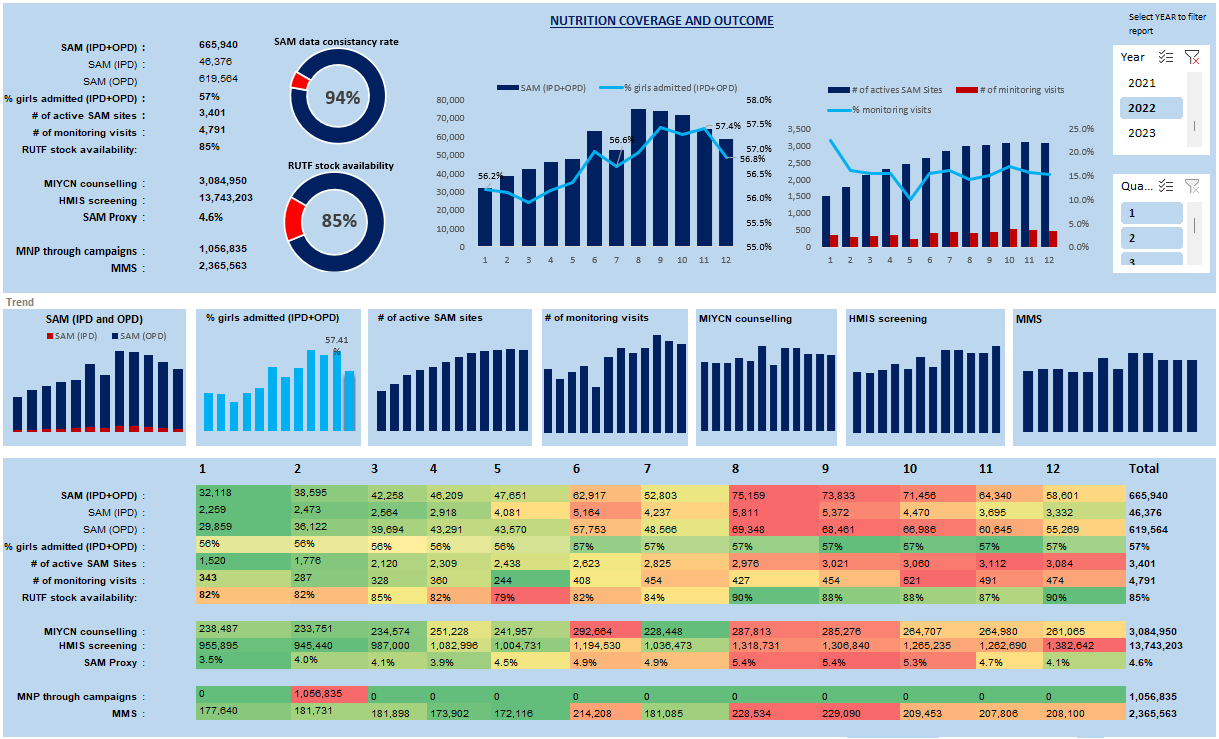
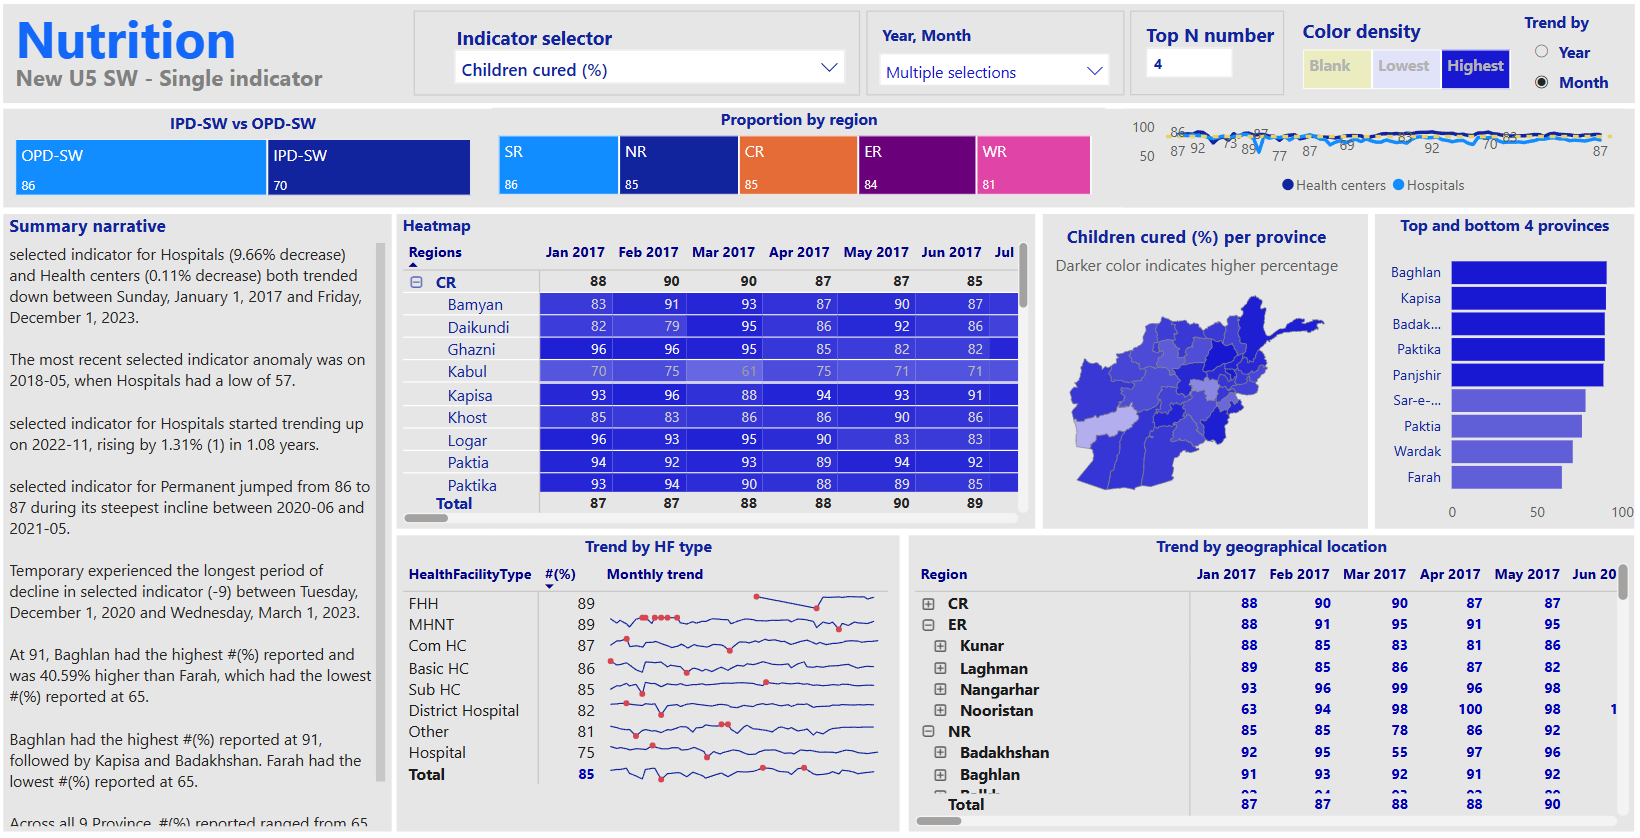
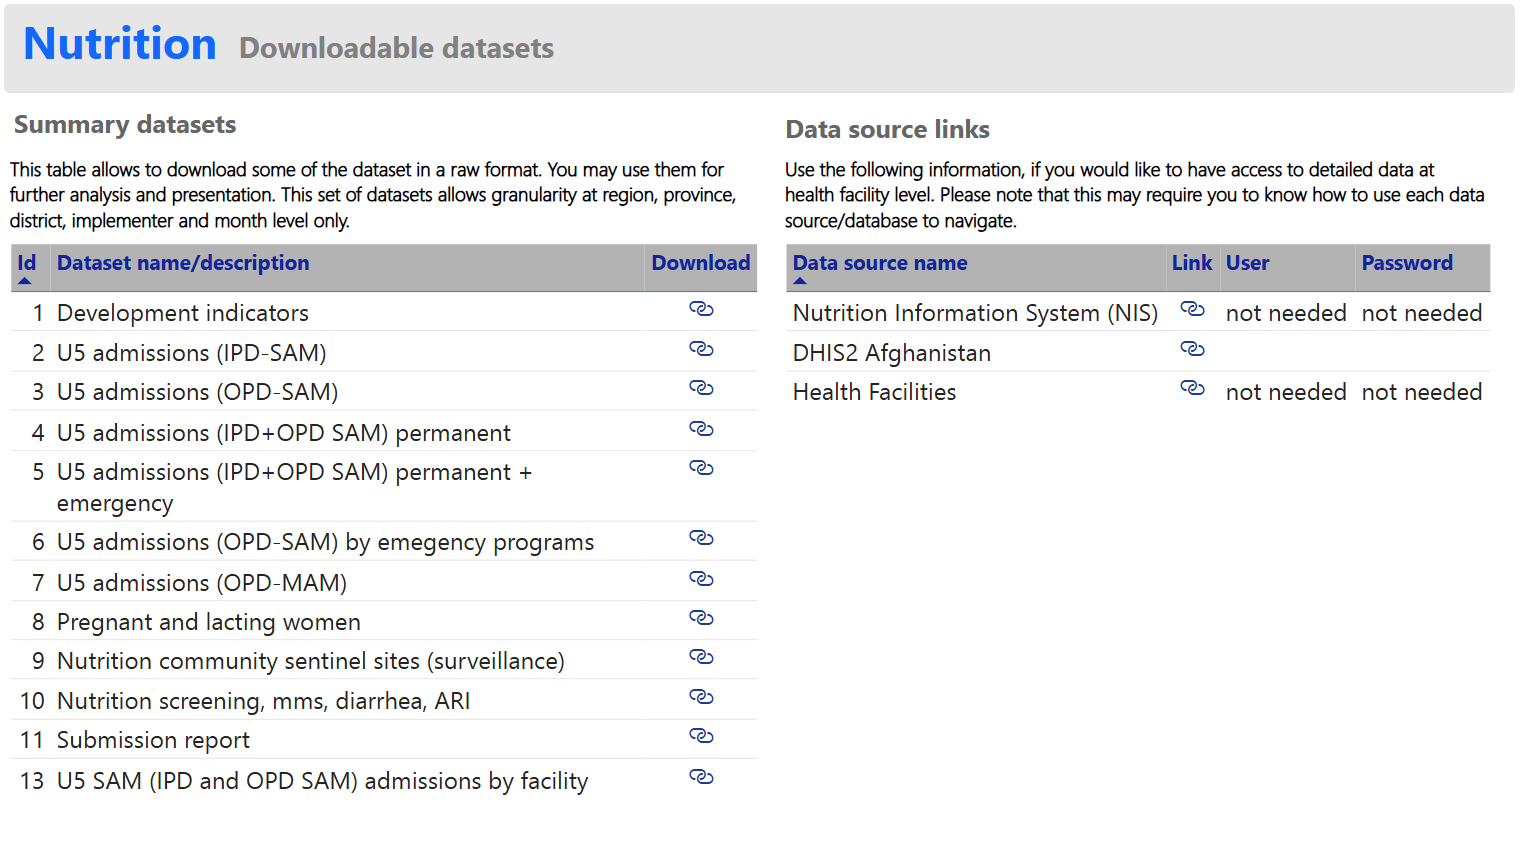
This is a robust Business Intelligence (BI) solution to enable UNICEF, the Ministry of Public Health (MoPH), implementers, and provincial health managers to monitor and analyze nutrition-related services across over 3,000 health facilities. This project leverages data from multiple sources to provide clear and insightful visualizations, facilitating informed decision-making and enhancing the effectiveness of health programs.
About the Project
The UNICEF Nutrition Services Analytics Dashboard is designed to collect, integrate, and visualize data related to nutrition services provided by UNICEF across numerous health facilities. By consolidating data from various sources, the dashboard offers a comprehensive overview of service delivery, resource allocation, and program performance, ensuring transparency and accountability in health service management.
Purpose of the Dashboard
- Metric and KPI Identification: Collaborated with UNICEF's information management specialist to review documents and gather requirements, identifying key metrics and performance indicators essential for monitoring nutrition services.
- Data Collection and Integration: Aggregated data from SQL databases, SQL Server data, and APIs from approximately eight different sources to create a unified dataset.
- Data Warehouse Design: Designed and built a scalable data warehouse using SQL Server to store and manage extensive nutrition and health service data efficiently.
- ETL Processes: Implemented Extract, Transform, Load (ETL) workflows using SQL Server Integration Services (SSIS) and Python to ensure accurate and consistent data integration.
- Automation and Refresh: Utilized an on-premises data gateway to handle automatic data refreshes, ensuring the dashboard always displays the most current information.
- Decision Support: Enabled data-driven decision-making for UNICEF, MoPH, implementers, and provincial health managers by providing actionable insights into service delivery and program performance.
Key Features of the Dashboard
- Metric and KPI Identification: Defined and implemented critical metrics and key performance indicators (KPIs) through thorough document reviews and requirement gathering.
- Data Integration: Consolidates data from SQL databases, SQL Server data, and APIs from approximately eight different sources to create a unified and comprehensive dataset.
- Data Warehouse Design: Built a scalable and efficient data warehouse using SQL Server to store and manage large volumes of nutrition and health service data.
- ETL Processes: Developed robust ETL workflows using SSIS and Python to clean, transform, and integrate data from diverse sources.
- Automation and Data Refresh: Implemented an on-premises data gateway to automate data refreshes, ensuring the dashboard reflects the latest data without manual intervention.
- Interactive Visualizations: Created dynamic PowerBI dashboards tailored to the specific needs of UNICEF, MoPH, implementers, and provincial health managers.
- Embedded PowerBI Dashboards: Integrated PowerBI dashboards into an ASP.NET MVC application, providing seamless access within a user-friendly web environment.
- Performance Analysis: Incorporated performance metrics and visualizations to assess the efficiency and effectiveness of nutrition programs and expenditures.
Technologies I Used
Data Warehouse | ETL Tools | Source Systems | BI & Visualization | Web Framework | Automation |
![]() |
![]() ![]() |
![]() ![]() ![]() |
![]() |
![]() |
![]() ![]() |
Steps Taken
- Metric and KPI Identification: Collaborated with stakeholders to review existing documents and gather requirements, identifying essential metrics and KPIs for monitoring nutrition services.
- Data Collection: Aggregated expenditure and service data from EMIS, SQL databases, SQL Server, and APIs from approximately eight different sources.
- Data Warehouse Design: Designed and implemented a SQL Server data warehouse to centralize and organize the collected data for efficient access and analysis.
- Extraction: Retrieved data from various sources, including SQL databases, SQL Server data, and external APIs.
- Transformation: Cleaned and transformed the data using SSIS and Python to ensure consistency, accuracy, and reliability.
- Loading: Imported the transformed data into the SQL Server data warehouse, ensuring seamless integration and accessibility.
- Scheduling ETL Jobs: Utilized SSIS and Python scripts to automate the ETL process, ensuring regular and timely data updates.
- On-Premises Data Gateway: Implemented an on-premises data gateway to handle automatic data refreshes.
- User Interface: Developed an ASP.NET MVC interface to allow users to trigger ETL processes as needed.
- Power Query Integration: Utilized Power Query to connect to the SQL Server data warehouse.
- Data Modeling: Structured the imported data to support effective analysis and visualization.
- Interactive Dashboards: Designed and built interactive dashboards featuring expenditure tracking, donation analysis, trend analysis, and performance analysis.
- DAX Formulas: Created calculated measures and columns using DAX for advanced analysis.
- Embedding Dashboards: Integrated Power BI dashboards into an ASP.NET Core application.
- Publishing & Refresh: Published dashboards to Power BI Premium and set up automatic data refreshes using an on-premises data gateway.
Outcome/Impact
Provided UNICEF, MoPH, implementers, and provincial health managers with a clear and comprehensive view of nutrition service expenditures and performance.
Enabled stakeholders to make data-driven decisions by highlighting key spending areas, donation allocations, and program effectiveness.
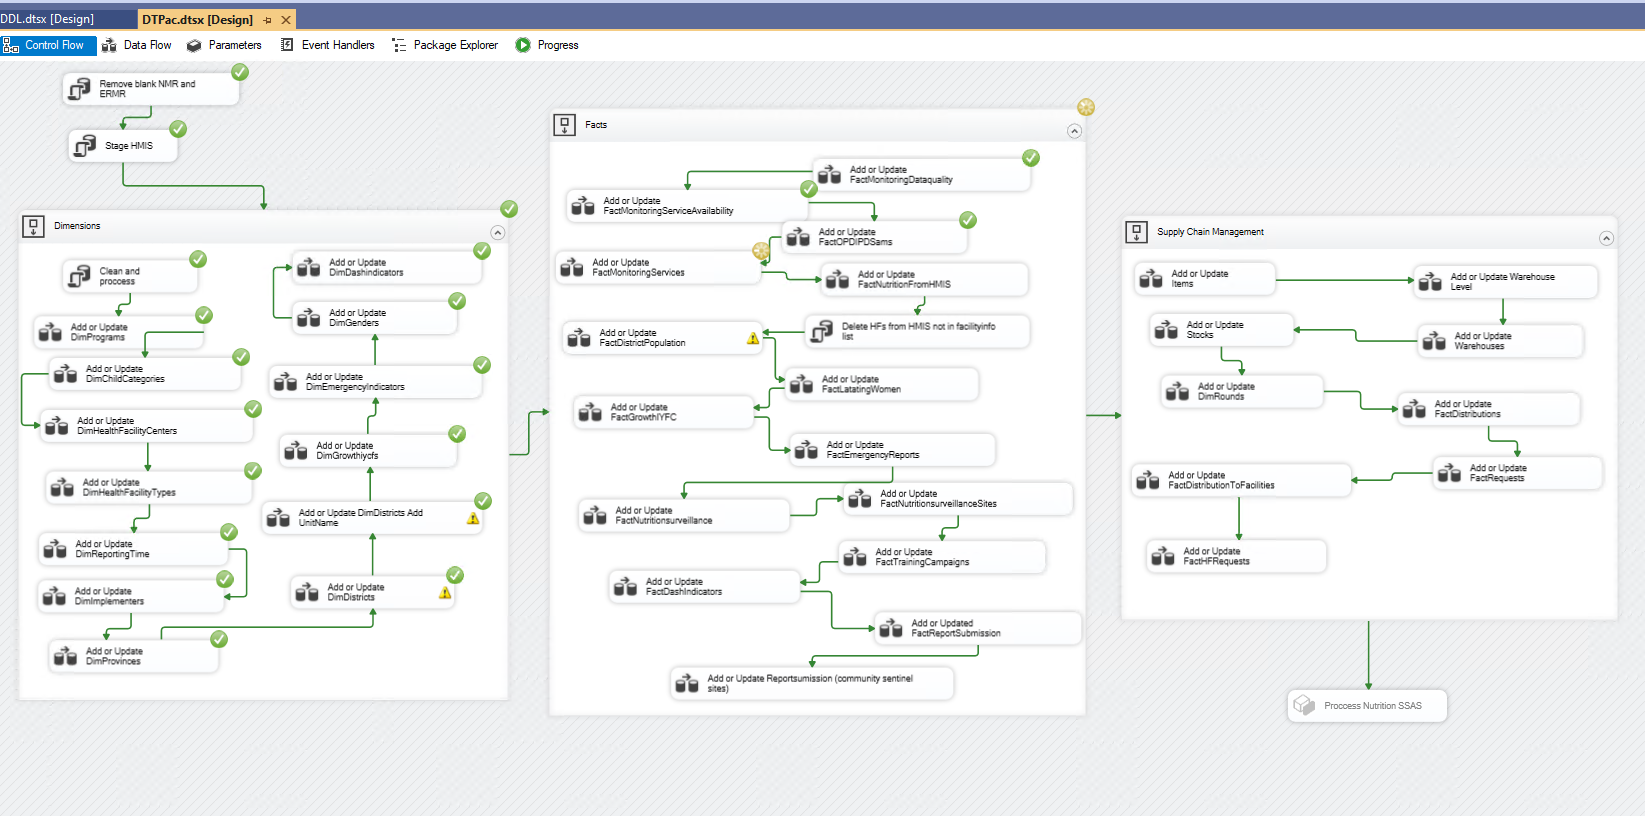
Automated ETL processes and data refreshes reduced manual effort and minimized errors, ensuring timely and accurate reporting.
Implemented Row-Level Security (RLS) to enable data access per user role without additional licensing costs, optimizing the project budget.
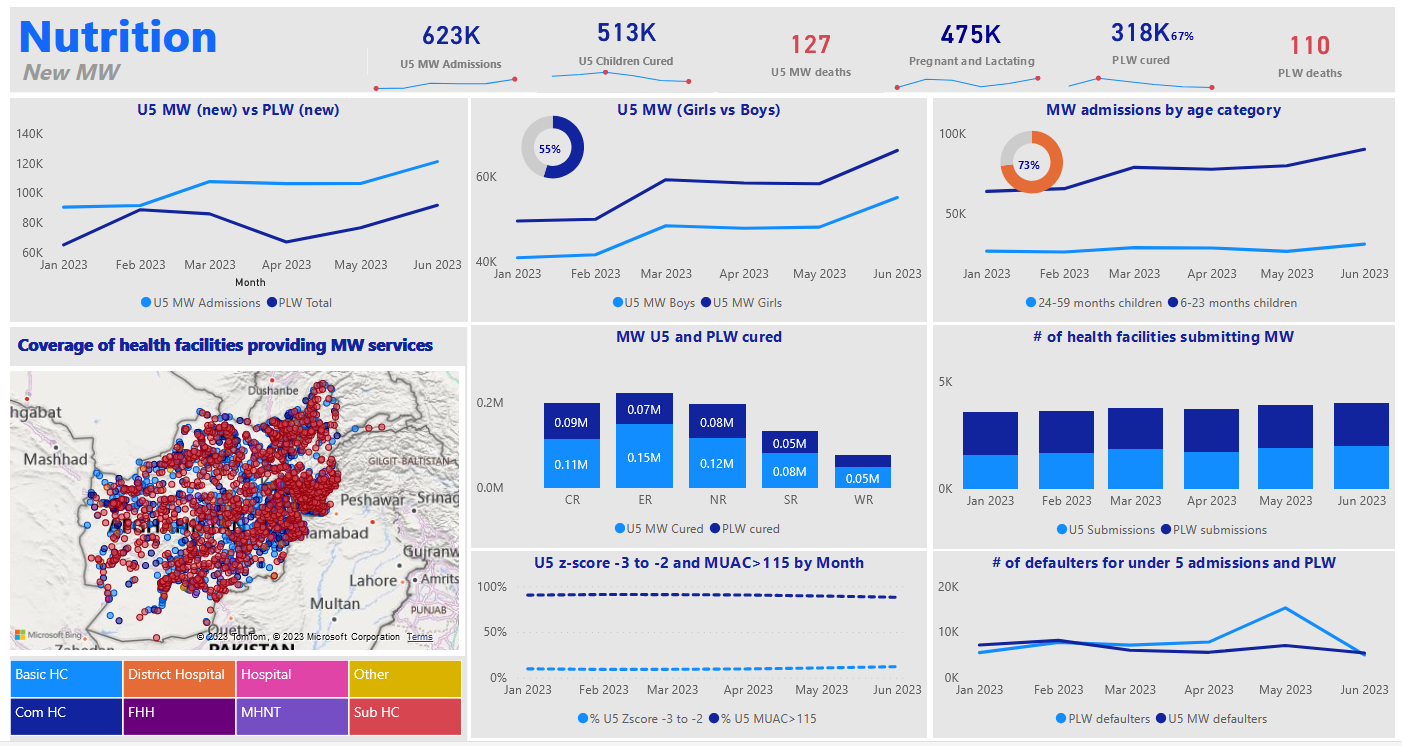
Embedded PowerBI dashboards into an ASP.NET Core application, enhancing accessibility and user satisfaction by providing a cohesive and user-friendly interface.
Delivered performance analysis metrics that allowed stakeholders to evaluate the effectiveness and efficiency of nutrition programs and expenditures.
Delivered a user-friendly interface and interactive dashboards that met the specific needs of UNICEF, MoPH, implementers, and provincial health managers.
Screenshots / Demo
Technical Highlights
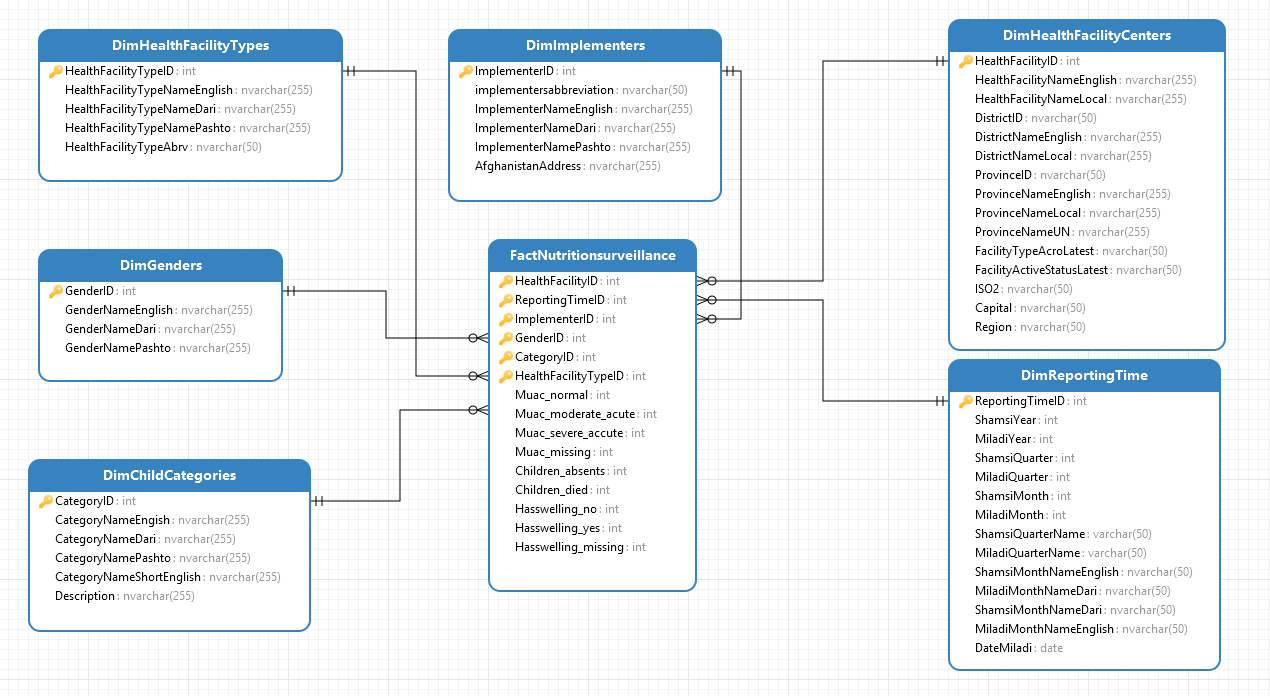
Consolidated data from SQL databases, SQL Server data, and APIs from approximately eight different sources to create a unified and comprehensive dataset.
Designed a scalable SQL Server data warehouse capable of handling large volumes of nutrition and health service data.
Developed robust ETL workflows using SSIS and Python to clean, transform, and integrate data from diverse sources.
Implemented an on-premises data gateway to automate data refreshes, ensuring the dashboard always displays the latest information.
Developed performance metrics and visualizations using DAX to evaluate the efficiency and effectiveness of nutrition programs and expenditures.
Performed comprehensive data modeling and wrote DAX formulas to create dynamic and insightful metrics for advanced data analysis.
Wrapping Up
The UNICEF Nutrition Services Analytics Dashboard project demonstrates my ability to design and implement a full-scale BI solution, encompassing data warehousing, ETL development, metric identification, data modeling, DAX formula creation, and dashboard embedding. By integrating multiple data sources, automating data processes, implementing Row-Level Security, and providing performance analysis, I delivered a powerful tool that supports effective management and allocation of resources in the nutrition and health sectors. The successful implementation of this dashboard has enhanced transparency, accountability, and informed decision-making for UNICEF, MoPH, implementers, and provincial health managers, all while optimizing costs and improving user experience.