Scalable Database Architecture
Designed database to support large-scale data processing for 5,000+ health facilities using SQL Server Database Management System.

| Data Cleaning | ETL & Data Transformation | BI & Visualization |
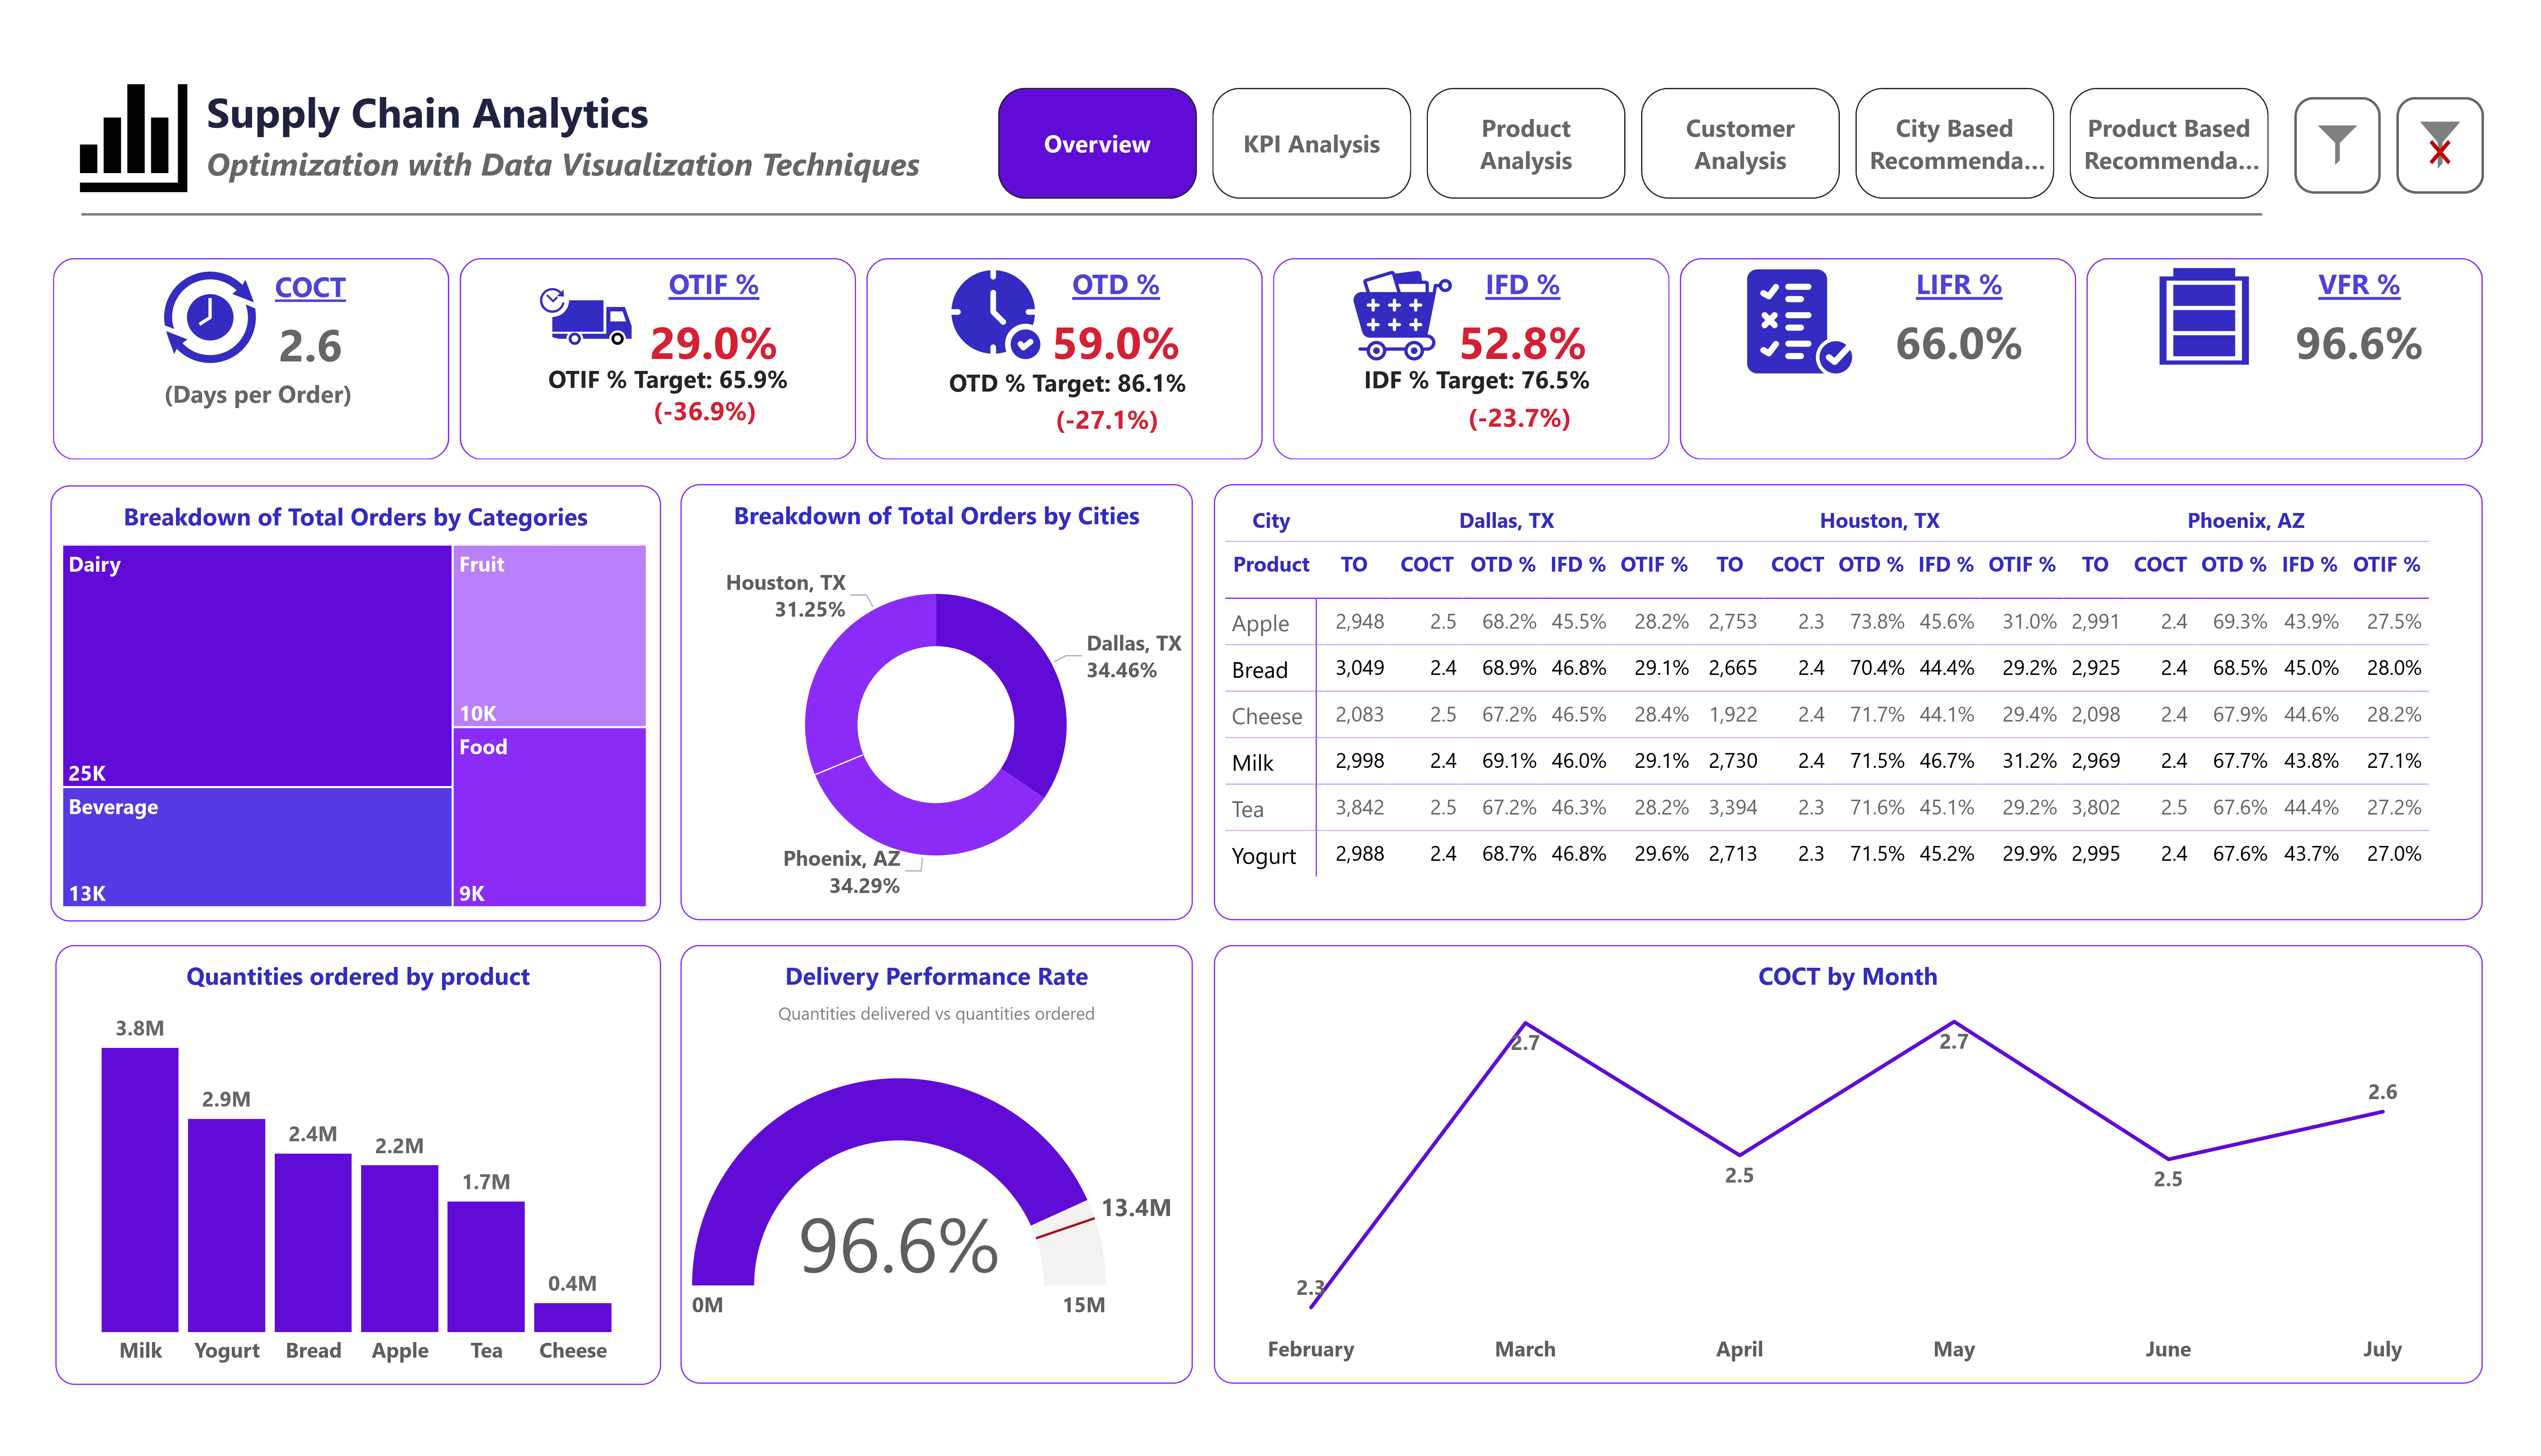
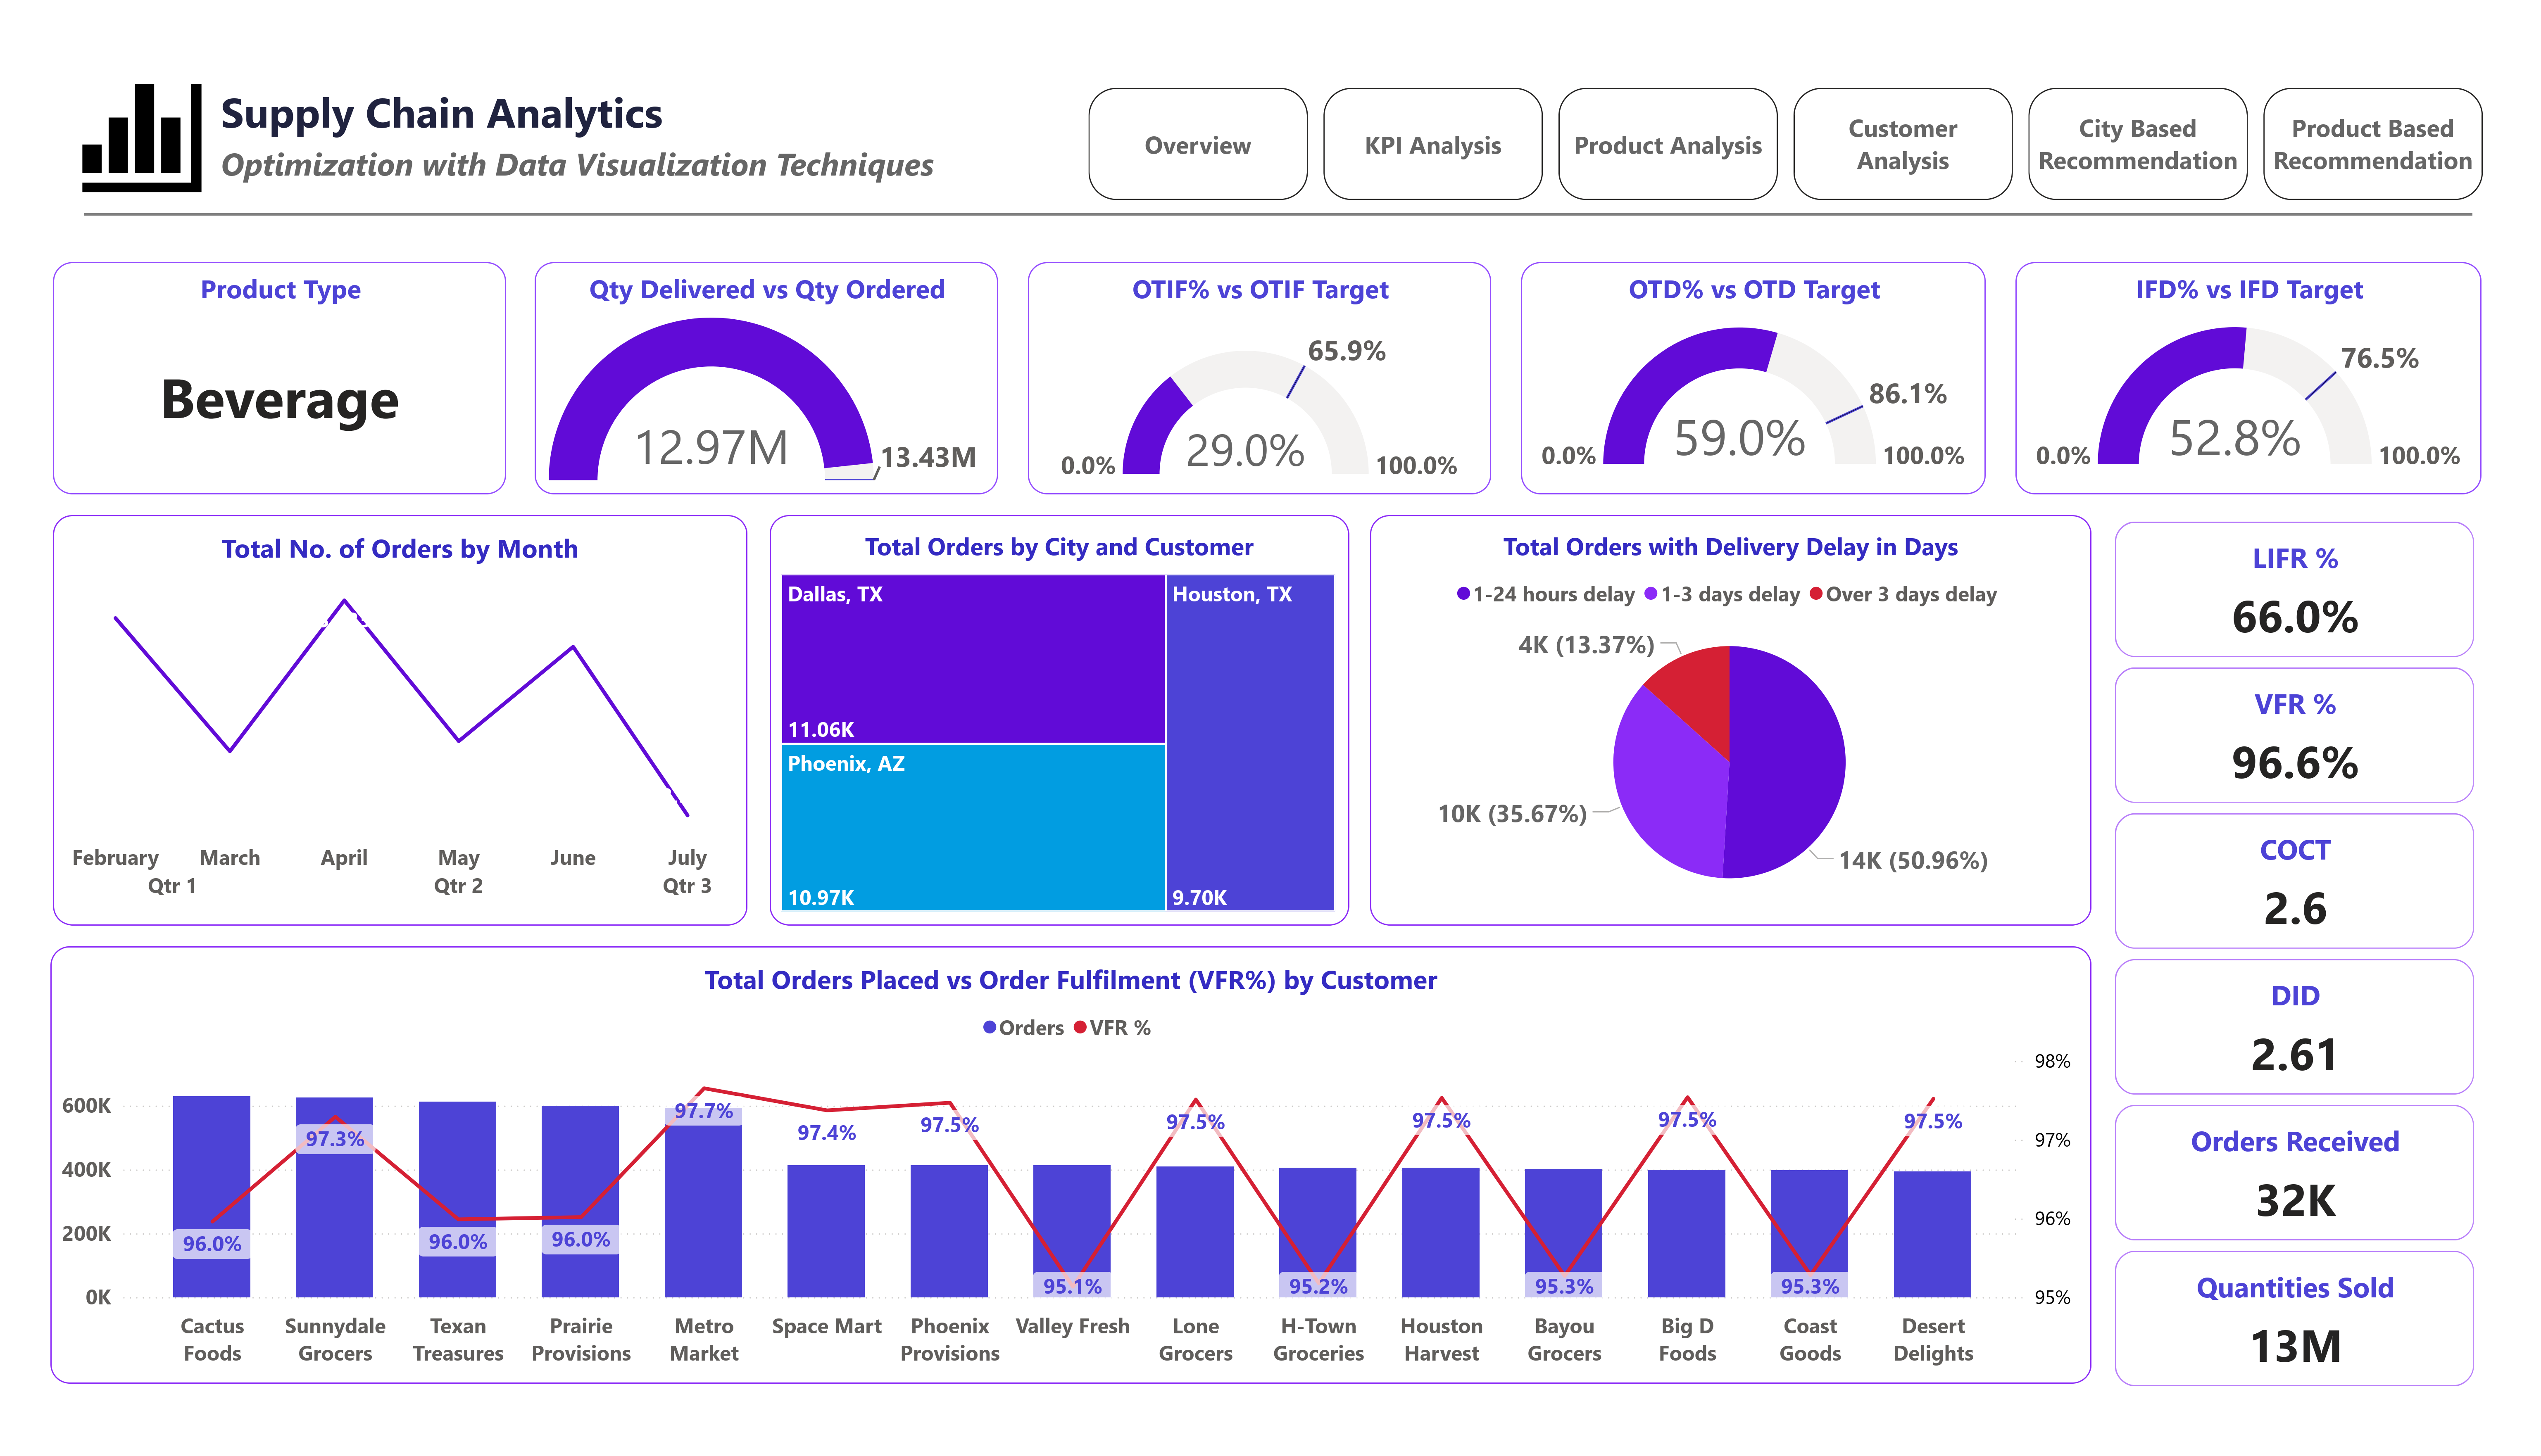
1. Average OTIF% was 29%, significantly below the target of 65.9%, signaling major delays and partial deliveries.
2. Delivery performance was below optimal levels across all three cities (Dallas, Houston, Phoenix).
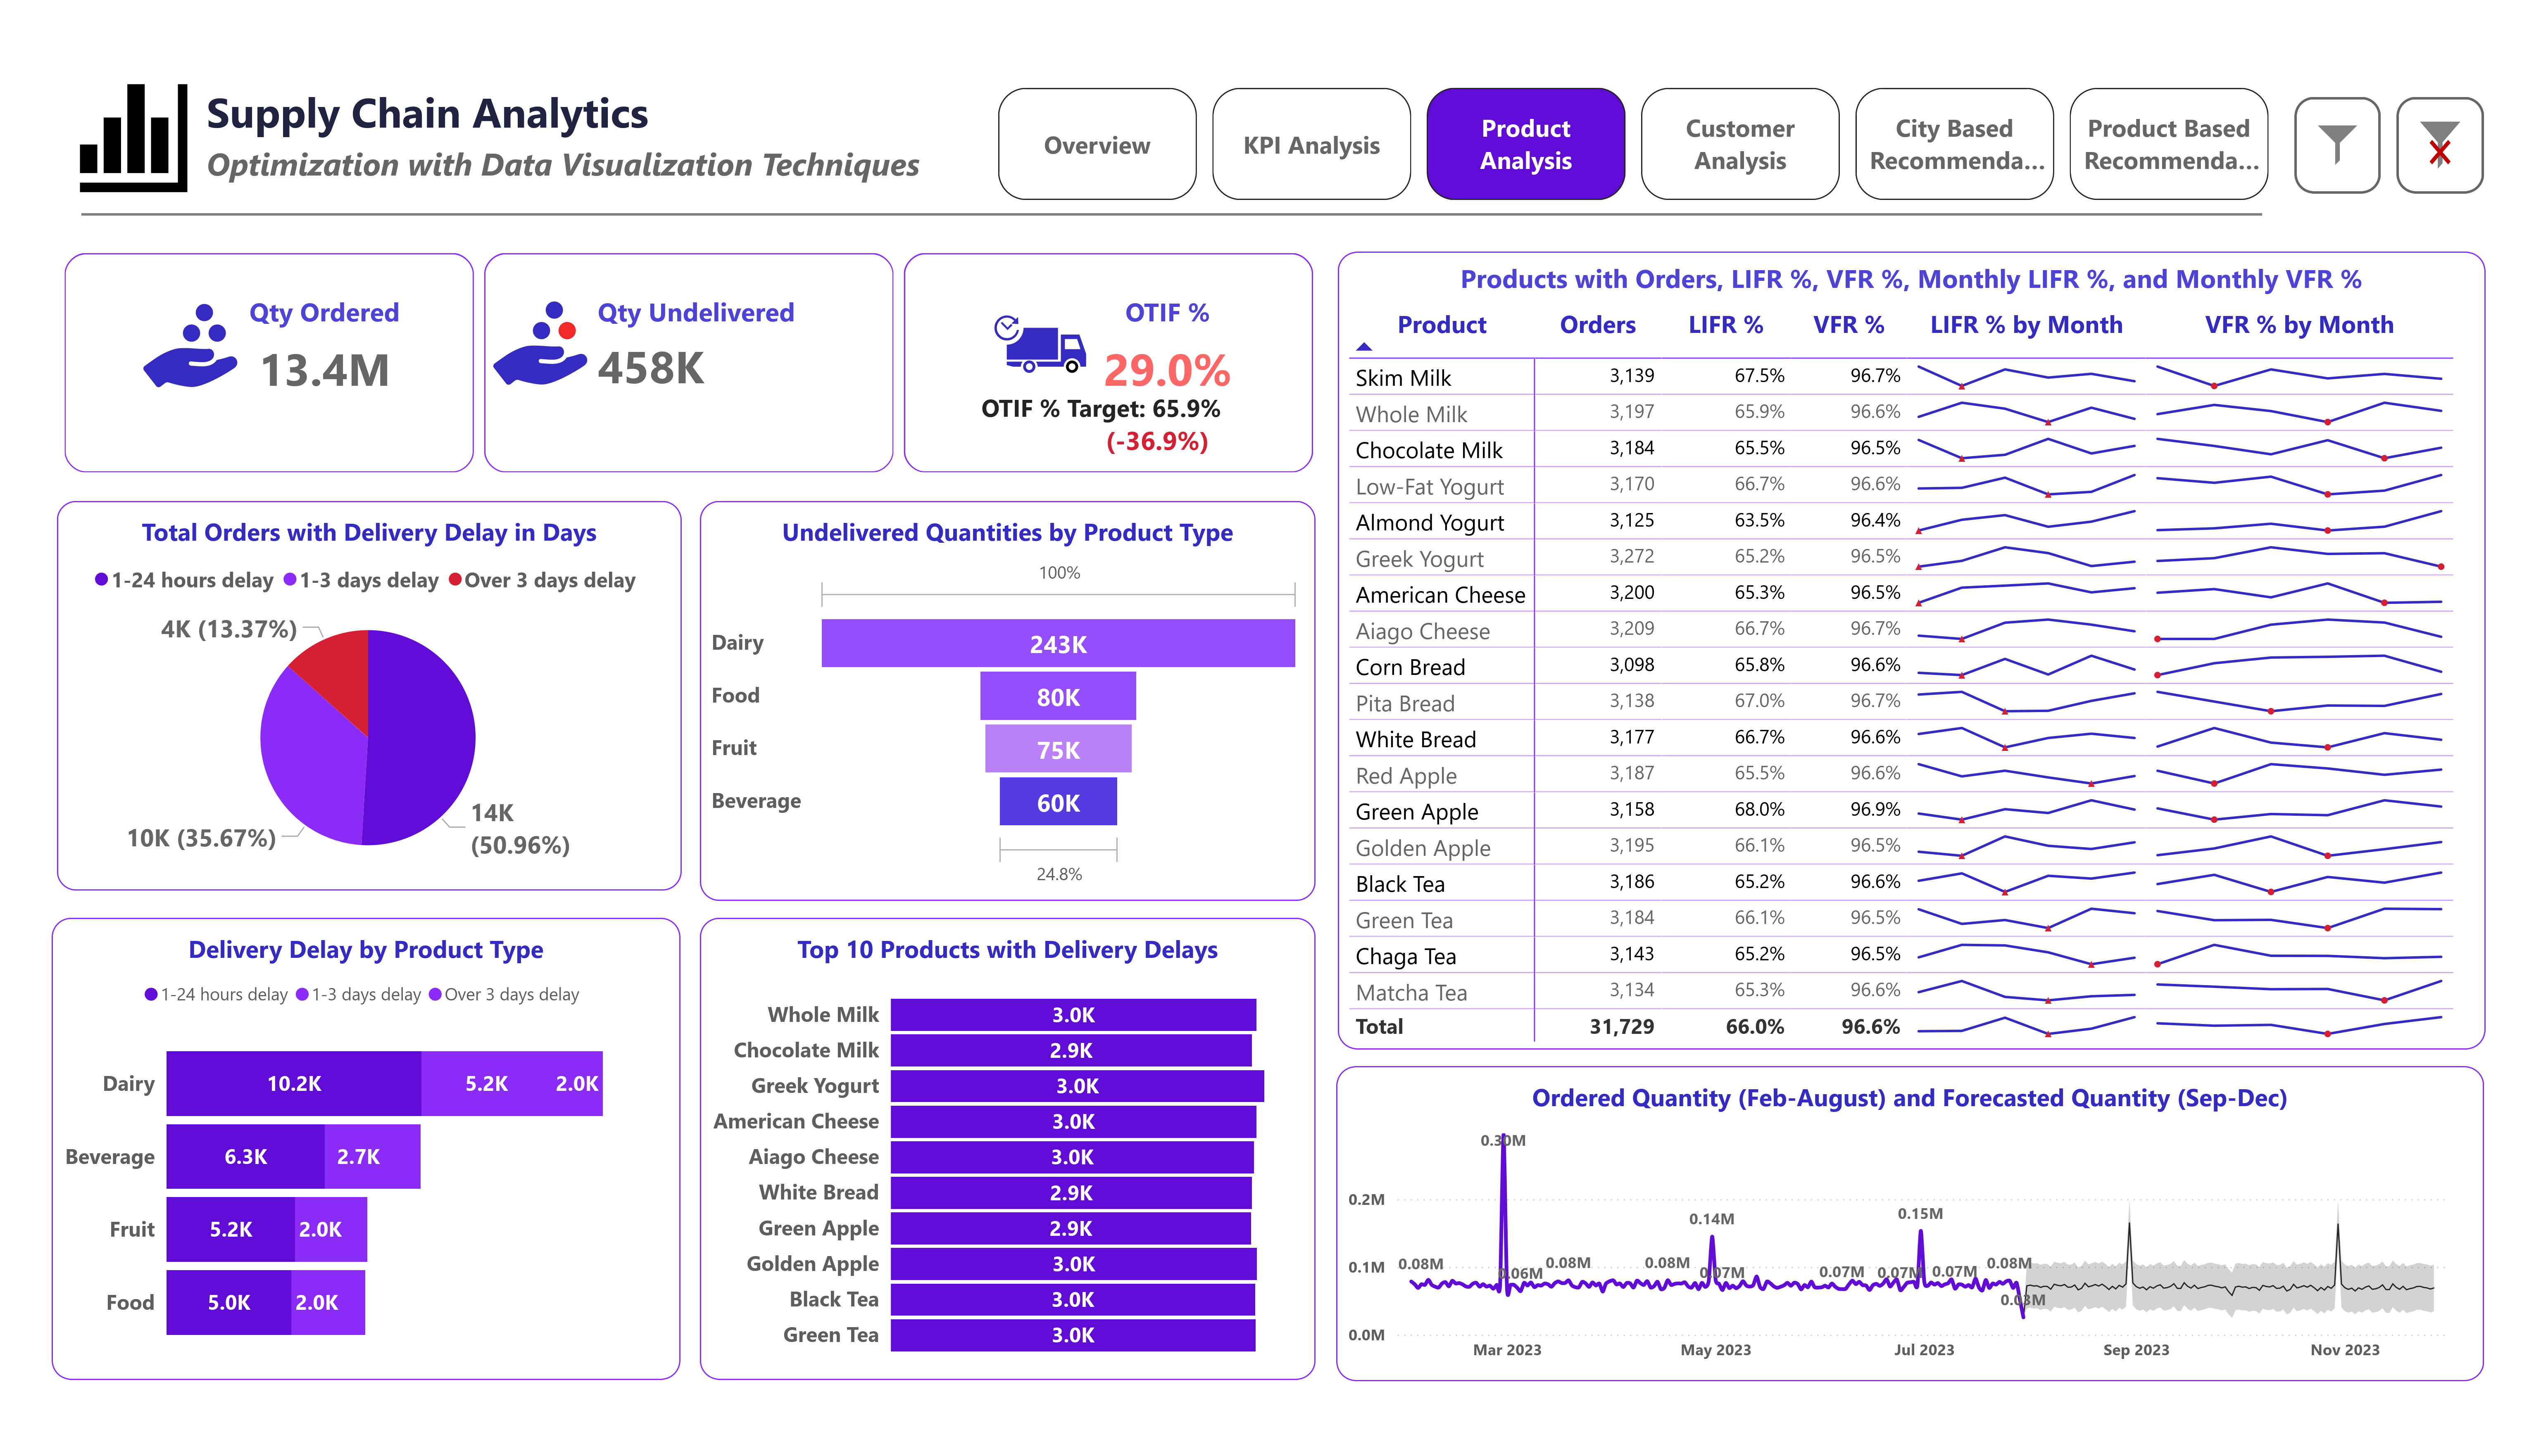
1.The top delayed products included Whole Milk, Chocolate Milk, Greek Yogurt, and American Cheese.
2. Most orders faced 1-3 day delays, leading to lower customer satisfaction and lost revenue opportunities.
1. Houston excelled in OTD% and OTIF%, while Phoenix had the most delays
2. Dallas showed the lowest fulfillment rates, needing improvement.
Designed database to support large-scale data processing for 5,000+ health facilities using SQL Server Database Management System.
Developed a set of stored procedures tailored to data movement, validation, and backup management. These procedures enable seamless data integrity checks, structured data transfers, and reliable disaster recovery mechanisms, minimizing manual intervention and processing delays.
Ensured daily database backups for disaster recovery and data integrity.
Implemented optimized indexing strategies tailored to frequently accessed columns. Since the database processes millions of records across 5,000+ health facilities, queries involving patient records, service utilization, inventory management, and financial transactions needed to be highly responsive.
The Supply Chain Analytics Dashboard project showcases my ability to transform raw supply chain data into actionable insights using Power BI. Through advanced data modeling, KPI tracking, and visualization techniques, I successfully delivered a solution that enables logistics managers, inventory planners, and business analysts to make data-driven supply chain optimizations.
This project highlights my expertise in Power BI development, supply chain analytics, and data-driven decision-making, demonstrating the real-world impact of interactive dashboards in logistics and operations management.
CREATE PROCEDURE [dbo].[UpdateHFMonitoringTableValues]
AS
BEGIN
    -- Delete orphaned records from DateValues, NumberValues, and TextValues tables
    DELETE FROM DateValues
    WHERE ReportId NOT IN (SELECT id FROM Reports);

    DELETE FROM NumberValues
    WHERE ReportId NOT IN (SELECT id FROM Reports);

    DELETE FROM TextValues
    WHERE ReportId NOT IN (SELECT id FROM Reports);

    -- Declare variables
    DECLARE @TotalReports INTEGER;
    DECLARE @DateValues INTEGER;
    DECLARE @NumberValues INTEGER;
    DECLARE @TextValues INTEGER;
    DECLARE @GrandTotal INTEGER;
    DECLARE @GrandTotal2 INTEGER;

    -- Get counts of NumberValues and TextValues
    SET @NumberValues = (SELECT COUNT(*) FROM NumberValues);
    SET @TextValues = (SELECT COUNT(*) FROM TextValues);

    -- Calculate GrandTotal from TempHFMonitoringrecords
    SET @GrandTotal = (
        SELECT NumberValues + TextValues AS Total
        FROM TempHFMonitoringrecords
    );

    SET @GrandTotal2 = @NumberValues + @TextValues;

    -- Compare GrandTotal values
    IF @GrandTotal <> @GrandTotal2
    BEGIN
        SET @TotalReports = (SELECT COUNT(*) FROM Reports);
        SET @DateValues = (SELECT COUNT(*) FROM DateValues);

        -- Truncate TempHFMonitoringrecords table
        TRUNCATE TABLE TempHFMonitoringrecords;

        -- Insert new values into TempHFMonitoringrecords
        INSERT INTO TempHFMonitoringrecords (TotalReports, NumberValues, DateValues, TextValues)
        VALUES (@TotalReports, @NumberValues, @DateValues, @TextValues);

        -- Execute related stored procedures
        EXEC dbo.spHFMonitoringNumberValues;
        EXEC dbo.spHFNutritionServicesValues;
        EXEC dbo.spHFMonitoringfindings;
        EXEC dbo.spHFSAMDataQuality;

        -- Optional: Uncomment to view records
        -- SELECT * FROM TempHFMonitoringrecords;
    END
END
SELECT
    ProvCode,
    ProvName,
    Year,
    Month,
    SUM(TotalNewCases) AS Num,
    1 AS Denom
FROM (
    -- First UNION query
    SELECT
        p.ProvCode,
        p.ProvName,
        n.Year,
        n.Month,
        SUM(ISNULL(otptfu.z3score, 0)) +
        SUM(ISNULL(otptfu.odema, 0)) +
        SUM(ISNULL(otptfu.MUAC115, 0)) AS TotalNewCases
    FROM dbo.NMR n
    INNER JOIN dbo.tblOTPTFU otptfu ON n.NMRID = otptfu.NMRID
    INNER JOIN dbo.FacilityInfo fi ON n.FacilityID = fi.FacilityID
    INNER JOIN dbo.Districts d ON fi.DistCode = d.DistCode
    INNER JOIN dbo.Provinces p ON d.ProvCode = p.ProvCode
    WHERE n.Year > 1395
    GROUP BY n.Year, n.Month, p.ProvCode, p.ProvName

    UNION ALL

    -- Second UNION query
    SELECT
        p1.ProvCode,
        p1.ProvName,
        n1.Year,
        n1.Month,
        SUM(ISNULL(otp.z3score, 0)) +
        SUM(ISNULL(otp.odema, 0)) +
        SUM(ISNULL(otp.MUAC115, 0)) AS TotalNewCases
    FROM dbo.NMR n1
    INNER JOIN dbo.tblOTP otp ON n1.NMRID = otp.NMRID
    INNER JOIN dbo.FacilityInfo fi1 ON n1.FacilityID = fi1.FacilityID
    INNER JOIN dbo.Districts d1 ON fi1.DistCode = d1.DistCode
    INNER JOIN dbo.Provinces p1 ON d1.ProvCode = p1.ProvCode
    WHERE n1.Year > 1395
    GROUP BY n1.Year, n1.Month, p1.ProvCode, p1.ProvName
) AS mm
GROUP BY ProvCode, ProvName, Year, Month;
SELECT
    CONCAT(p.ProvCode, tpc.FacilityTypeId, tpc.IndicatorId, tpc.[Year], tpc.[Month]) AS Id,
    p.ProvCode AS ProvinceId,
    p.ProvName AS Province,
    tpc.FacilityTypeId,
    ft.TypeAbbrv AS FacilityType,
    tpc.IndicatorId,
    ic.IndicatorName,
    tpc.Implementer,
    tpc.Module,
    tpc.Year AS [Year],
    tpc.Month AS [Month],
    tpc.Quarter AS Quarter,
    SUM(tpc.Num) AS Num,
    SUM(tpc.Denom) AS Denom
FROM dbo.totalpivotcombined_sbp tpc
INNER JOIN dbo.FacilityInfo fi ON tpc.FacilityID = fi.FacilityID
INNER JOIN dbo.Districts d ON fi.DistCode = d.DistCode
INNER JOIN dbo.Provinces p ON d.ProvCode = p.ProvCode
INNER JOIN dbo.FacilityTypes ft ON fi.FacilityType = ft.FacTypeCode
INNER JOIN dbo.Indicatorscombined ic ON tpc.IndicatorId = ic.IndicatorId
GROUP BY
    p.ProvCode,
    p.ProvName,
    tpc.FacilityTypeId,
    ft.TypeAbbrv,
    tpc.IndicatorId,
    ic.IndicatorName,
    tpc.Implementer,
    tpc.Module,
    tpc.Year,
    tpc.Month,
    tpc.Quarter;
WITH CTE_HF_ReqDetails AS (
    SELECT
        hfrd.Id,
        hfrd.RequestId,
        hfrd.FacilityId,
        fi.FacilityName,
        hfrd.SupplyId,
        hfrd.FacilityTypeId,
        ft.TypeAbbrv AS FacilityType,
        d.DistName AS District,
        p.ProvName AS Province,
        imp.ImpAcronym AS Implementer,
        CONVERT(INT, hfrd.Children) AS Children,
        CONVERT(FLOAT, ROUND(hfrd.Buffer, 2)) AS Buffer,
        CONVERT(INT, hfrd.CurrentBalance) AS CurrentBalance,
        CONVERT(INT, hfrd.Adjustment) AS Adjustment,
        hfrd.AdjComment,
        CONVERT(FLOAT, hfrd.StockForChildren) AS StockForChildren,
        hfrd.Program,
        tss.Item,
        CONVERT(FLOAT, ISNULL(hfrd.Adjustment, 0)) +
        CONVERT(FLOAT, ISNULL(hfrd.StockForChildren, 0)) AS TotalNeeded,
        hfrd.Esttype,
        sr.RequesttypeId,
        -- Adding a row number to uniquely identify each record per facility & supply
        ROW_NUMBER() OVER (PARTITION BY hfrd.FacilityId, hfrd.SupplyId ORDER BY hfrd.RequestId DESC) AS RowNum,
        -- Calculating the running total of stock adjustments per facility
        SUM(hfrd.Adjustment) OVER (PARTITION BY hfrd.FacilityId ORDER BY hfrd.RequestId) AS RunningTotalAdjustment,
        -- Calculating the average buffer per province
        AVG(hfrd.Buffer) OVER (PARTITION BY p.ProvCode) AS AvgBufferPerProvince
    FROM dbo.scmHFReqDetails hfrd
    INNER JOIN dbo.FacilityInfo fi ON hfrd.FacilityId = fi.FacilityID
    INNER JOIN dbo.FacilityTypes ft ON hfrd.FacilityTypeId = ft.FacTypeCode
    INNER JOIN dbo.tlkpSstock tss ON hfrd.SupplyId = tss.sstockID
    INNER JOIN dbo.Districts d ON fi.DistCode = d.DistCode
    INNER JOIN dbo.scmRequest srq ON hfrd.RequestId = srq.RequestId
    INNER JOIN dbo.scmRounds sr ON srq.RequestPeriod = sr.RoundId
    INNER JOIN dbo.Provinces p ON srq.ProvinceId = p.ProvCode
    INNER JOIN dbo.Implementers imp ON srq.ImpId = imp.ImpCode
)
SELECT * FROM CTE_HF_ReqDetails;
ALTER PROCEDURE [dbo].[UpdateNutritionMNPCampaigns]
    @Username NVARCHAR(50)
AS
BEGIN
    SET NOCOUNT ON; -- Prevent extra result sets from interfering with SELECT statements.

    -- Insert new records into NutritionMNPCampaigns if they do not already exist
    INSERT INTO [dbo].[NutritionMNPCampaigns] (
        ProvinceID, Year, Month,
        Children6to59MonthReceivedMNPMale, Children6to59MonthReceivedMNPFemale,
        MDsTrainedOnMIYCNMale, MDsTrainedOnMIYCNFemale, MidwivesTrainedOnMIYCN,
        NursesTrainedOnMIYCNMale, NursesTrainedOnMIYCNFemale,
        NCsReceived12DaysInitialTraining, NCsReceived6DaysRefresherTraining,
        FoodDemoSessions, CHWsReceivedMonthlyIncentiveMale, CHWsReceivedMonthlyIncentiveFemale,
        TargetWomenReceivedCashWithNutritionServices,
        BoysUnder2WeightedForGrowthCommunity, GirlsUnder2WeightedForGrowthCommunity,
        NoofAdolescentGirlsReceivedIronFolicAcid,
        ChschwstrainedonCBNPmale, ChschwstrainedonCBNPfemale,
        ChschwstrainedonMNPmale, ChschwstrainedonMNPfemale,
        ChwschwstrainedoncomWIFSmale, ChwschwstrainedoncomWIFSfemale,
        ChwschwstrainedonmontherMUACmale, ChwschwstrainedonmontherMUACfemale,
        CampaignVitaminAMale, CampaignVitaminAFemale,
        NoHPsupportedbyCBNPprogram, Username, Updatedate
    )
    SELECT
        v.ProvinceID, v.Year, v.Month,
        v.Children6to59MonthReceivedMNPMale, v.Children6to59MonthReceivedMNPFemale,
        v.MDsTrainedOnMIYCNMale, v.MDsTrainedOnMIYCNFemale, v.MidwivesTrainedOnMIYCN,
        v.NursesTrainedOnMIYCNMale, v.NursesTrainedOnMIYCNFemale,
        v.NCsReceived12DaysInitialTraining, v.NCsReceived6DaysRefresherTraining,
        v.FoodDemoSessions, v.CHWsReceivedMonthlyIncentiveMale, v.CHWsReceivedMonthlyIncentiveFemale,
        v.TargetWomenReceivedCashWithNutritionServices,
        v.BoysUnder2WeightedForGrowthCommunity, v.GirlsUnder2WeightedForGrowthCommunity,
        v.NoofAdolescentGirlsReceivedIronFolicAcid,
        v.ChschwstrainedonCBNPmale, v.ChschwstrainedonCBNPfemale,
        v.ChschwstrainedonMNPmale, v.ChschwstrainedonMNPfemale,
        v.ChwschwstrainedoncomWIFSmale, v.ChwschwstrainedoncomWIFSfemale,
        v.ChwschwstrainedonmontherMUACmale, v.ChwschwstrainedonmontherMUACfemale,
        v.CampaignVitaminAMale, v.CampaignVitaminAFemale,
        v.NoHPsupportedbyCBNPprogram, v.Username, v.Updatedate
    FROM dbo.vTempNutritionMNPCampaigns v
    WHERE
        CONCAT(v.ProvinceID, v.Year, v.Month) NOT IN
        (SELECT CONCAT(ProvinceID, Year, Month) FROM NutritionMNPCampaigns)
        AND v.ProvinceID IS NOT NULL
        AND (v.Year * 100 + v.Month) <= (YEAR(GETDATE()) * 100 + MONTH(GETDATE()));

    -- Update existing records if they were updated within the last 60 days by the specified user
    UPDATE n
    SET
        n.Children6to59MonthReceivedMNPMale = t.Children6to59MonthReceivedMNPMale,
        n.Children6to59MonthReceivedMNPFemale = t.Children6to59MonthReceivedMNPFemale,
        n.MDsTrainedOnMIYCNMale = t.MDsTrainedOnMIYCNMale,
        n.MDsTrainedOnMIYCNFemale = t.MDsTrainedOnMIYCNFemale,
        n.MidwivesTrainedOnMIYCN = t.MidwivesTrainedOnMIYCN,
        n.NursesTrainedOnMIYCNMale = t.NursesTrainedOnMIYCNMale,
        n.NursesTrainedOnMIYCNFemale = t.NursesTrainedOnMIYCNFemale,
        n.NCsReceived12DaysInitialTraining = t.NCsReceived12DaysInitialTraining,
        n.NCsReceived6DaysRefresherTraining = t.NCsReceived6DaysRefresherTraining,
        n.FoodDemoSessions = t.FoodDemoSessions,
        n.CHWsReceivedMonthlyIncentiveMale = t.CHWsReceivedMonthlyIncentiveMale,
        n.CHWsReceivedMonthlyIncentiveFemale = t.CHWsReceivedMonthlyIncentiveFemale,
        n.TargetWomenReceivedCashWithNutritionServices = t.TargetWomenReceivedCashWithNutritionServices,
        n.BoysUnder2WeightedForGrowthCommunity = t.BoysUnder2WeightedForGrowthCommunity,
        n.GirlsUnder2WeightedForGrowthCommunity = t.GirlsUnder2WeightedForGrowthCommunity,
        n.NoofAdolescentGirlsReceivedIronFolicAcid = t.NoofAdolescentGirlsReceivedIronFolicAcid,
        n.ChschwstrainedonCBNPmale = t.ChschwstrainedonCBNPmale,
        n.ChschwstrainedonCBNPfemale = t.ChschwstrainedonCBNPfemale,
        n.ChschwstrainedonMNPmale = t.ChschwstrainedonMNPmale,
        n.ChschwstrainedonMNPfemale = t.ChschwstrainedonMNPfemale,
        n.ChwschwstrainedoncomWIFSmale = t.ChwschwstrainedoncomWIFSmale,
        n.ChwschwstrainedoncomWIFSfemale = t.ChwschwstrainedoncomWIFSfemale,
        n.ChwschwstrainedonmontherMUACmale = t.ChwschwstrainedonmontherMUACmale,
        n.ChwschwstrainedonmontherMUACfemale = t.ChwschwstrainedonmontherMUACfemale,
        n.CampaignVitaminAMale = t.CampaignVitaminAMale,
        n.CampaignVitaminAFemale = t.CampaignVitaminAFemale,
        n.NoHPsupportedbyCBNPprogram = t.NoHPsupportedbyCBNPprogram,
        n.Username = t.Username,
        n.Updatedate = t.Updatedate
    FROM NutritionMNPCampaigns n
    INNER JOIN vTempNutritionMNPCampaigns t
        ON n.ProvinceID = t.ProvinceID
        AND n.Year = t.Year
        AND n.Month = t.Month
    WHERE
        n.Username = @Username
        AND DATEDIFF(DAY, n.Updatedate, GETDATE()) < 60;
END;